Plot the distribution of the median RT across participants
Source:R/plot_median_rt_distribution.R
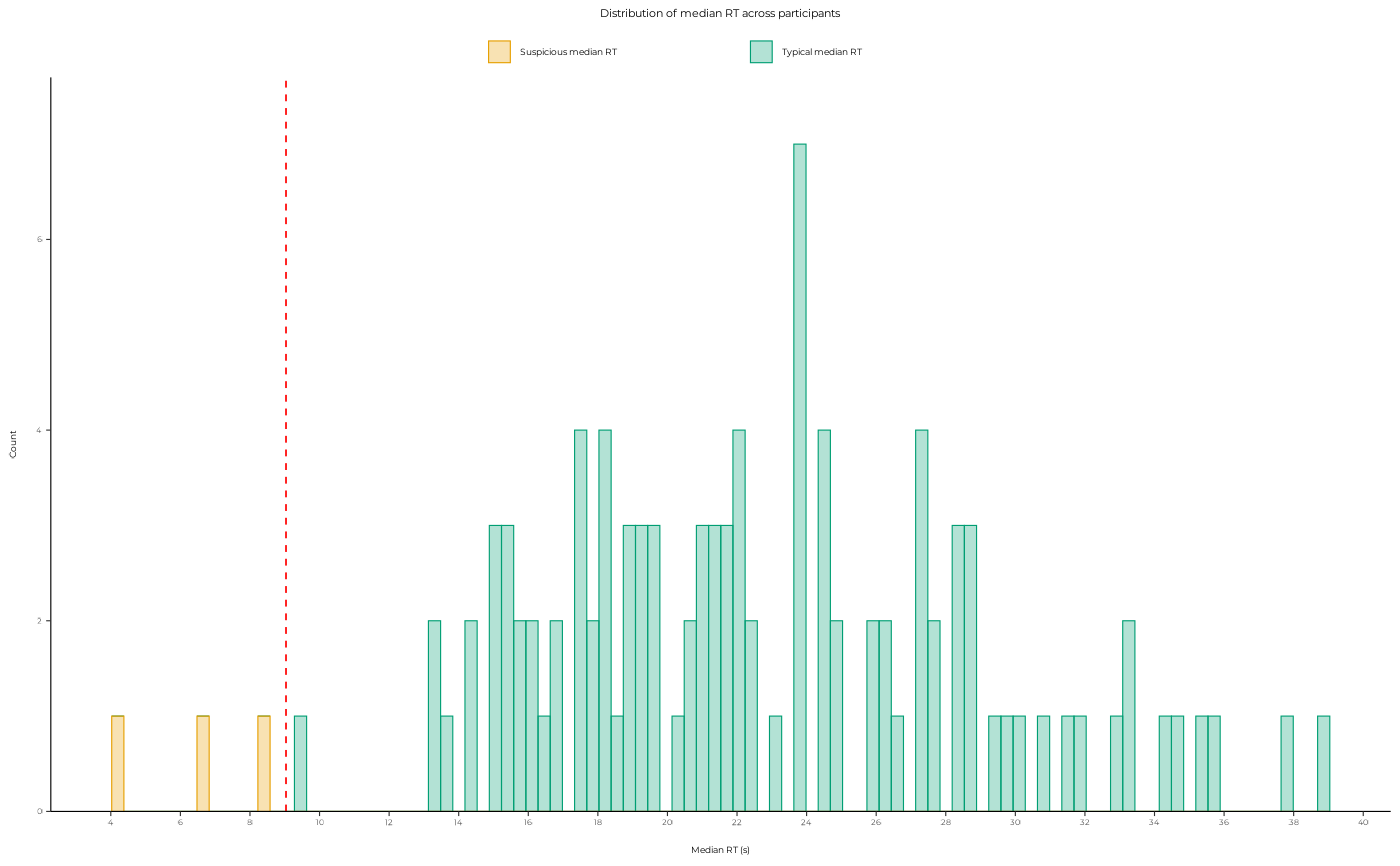
plot_median_rt_distribution.RdPlot the distribution of the median RT across participants
Arguments
- df
A data frame containing participant responses with an
idcolumn and art_totalfor each trial.- sd_mult
A numeric value indicating how many standard deviations to use for identifying suspicious median RTs. The default is 2, which means that median RTs that are more than 2 standard deviations away from the mean will be considered suspicious.
- ...
Additional arguments passed to the
theme_pdf()function for customizing the plot theme.
Value
A ggplot2 object showing the distribution of median RTs across participants, with suspicious median RTs highlighted.
Examples
df <- get_clean_data(sd_mult = 10)$df_expe
plot_median_rt_distribution(df)