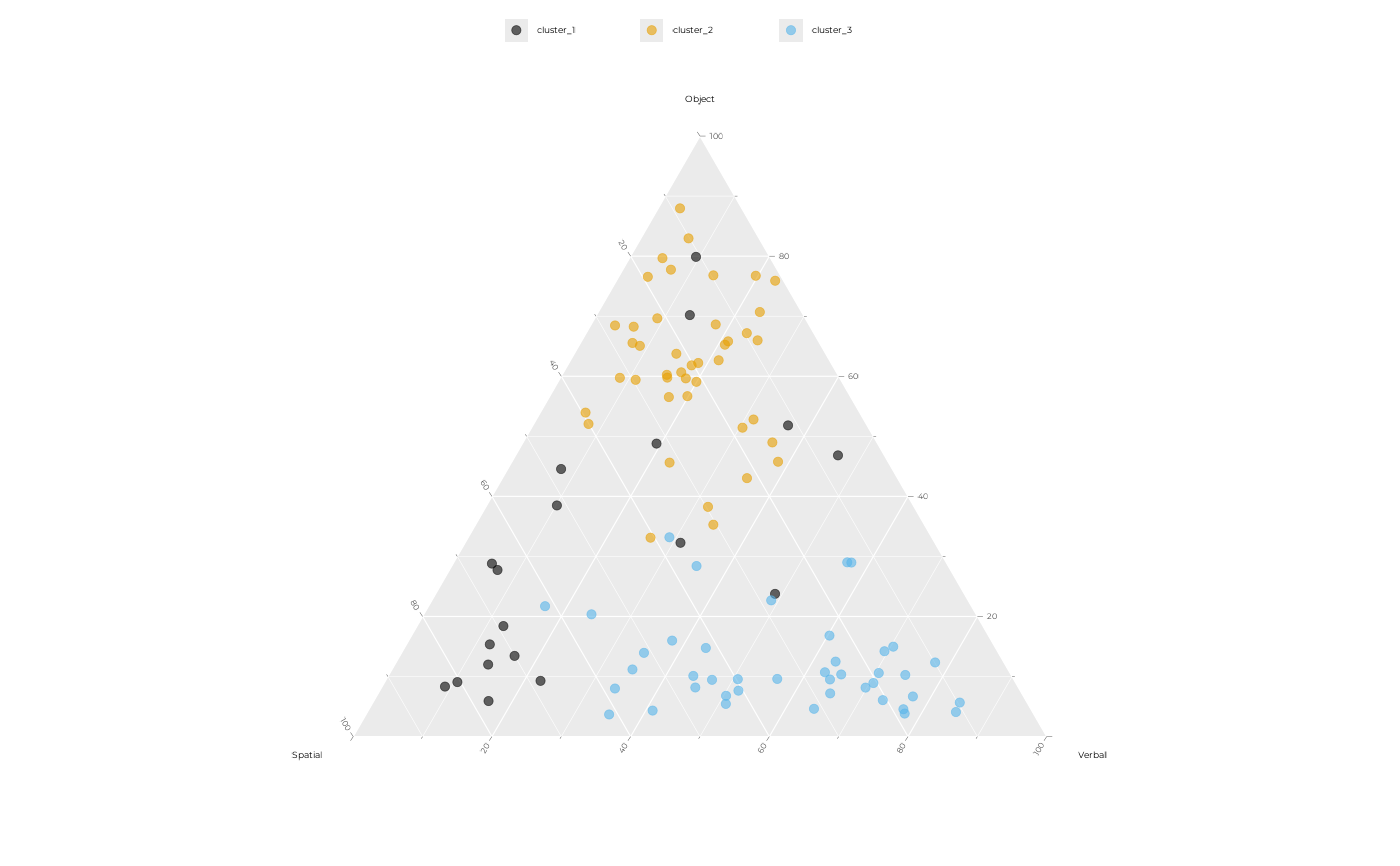
Plot the OSIVQ scores of clusters in a ternary diagram
Source:R/plot_osivq_ternary.R
plot_osivq_ternary.RdPlot the OSIVQ scores of clusters in a ternary diagram
Usage
plot_osivq_ternary(
  df,
  dot_size = 1.5,
  plot_it = FALSE,
  colours = palette.colors(),
  ...
)
Arguments
- df
A dataframe containing
osivq_object,osivq_spatial,osivq_verbalandclustercolumns.- dot_size
Size of the dots in the plot.
- plot_it
Logical. If TRUE, the plot will be printed immediately.
- colours
A vector of colours to use for the clusters in the plot passed to the
ggplot2::scale_discrete_manual()function. Default ispalette.colors().- ...
Additional arguments passed to the
theme_pdf()function.
Examples
df <- get_clean_data()$df_survey

# Clustering the sample based on OSIVQ scores
clustering <- cluster_osivq(df)
df <- add_named_clusters(df, clustering)

plot_osivq_ternary(df, base_theme = ggplot2::theme_grey)
#> Registered S3 methods overwritten by 'ggtern':
#>   method           from
#>   grid.draw.ggplot ggplot2
#>   plot.ggplot      ggplot2
#>   print.ggplot     ggplot2