Unsupervised clustering reveals spatial and verbal cognitive profiles in aphantasia and typical imagery
Keywords: aphantasia, mental imagery, individual differences, cognitive profiles, reasoning, working memory, unsupervised clustering
1 Introduction
Visual imagery, commonly referred to as “seeing with the mind’s eye”, designates the pseudo-perceptual visual experience of mental images in the absence of the corresponding external stimulus (Pearson, 2019). There are large individual differences in visual imagery vividness (i.e. the intensity and detail of mental images) across a spectrum going from the absence of mental imagery, a phenomenon recently named “aphantasia” (Zeman et al., 2015), to extremely vivid and perception-like imagery, named “hyperphantasia” (Zeman et al., 2020). The introduction of the term “aphantasia” in 2015 led to a wave of research on the subject, exploring its underlying causes and consequences and potential positive or negative outcomes. A large body of research on aphantasia mainly identified potential deficits associated with it. Specifically, the condition has been associated with a reduction in autobiographical memory (Dawes et al., 2020, 2022; Milton et al., 2021; Monzel, Leelaarporn, et al., 2023), lack of atemporal and future imagination (Milton et al., 2021), increased face recognition difficulties (Milton et al., 2021; Palermo et al., 2022; Zeman et al., 2020), reduced dreams (Dawes et al., 2020), or decreased motor simulation (Dupont et al., 2024). This focus on deficits has left the potential positive aspects of aphantasia largely unexplored, even though empirical evidence from recent studies has shown that individuals with aphantasia performed as well as those with “typical” visual imagery in various types of tasks presumed to require this ability, such as visual or visuo-spatial working memory (Keogh et al., 2021; Pounder et al., 2022; Reeder et al., 2024). Research that hinted at advantages of aphantasia have focused mainly on emotional processing. Individuals with aphantasia have been shown to be less prone to sensory sensitivity (Dance et al., 2021), less reactive to the reading of frightening scenarios (Wicken et al., 2021), and less sensible to intrusive memories (Keogh et al., 2023) suggesting that aphantasia could help to reduce sensory overwhelm, and potentially protect against emotional overreaction.
Recently, Monzel et al. (2023) proposed that aphantasia should be understood within the framework of “neurodivergence” as a state representing atypical but functional cognitive processing, with advantages and disadvantages. The specifics of this “alternative thinking” and its advantages, however, remain to be understood. Interestingly, Zeman et al. (2020) found that individuals with aphantasia seemed more likely to work in STEM fields (Science, Technology, Engineering, and Mathematics), whereas hyperphantasics, at the other end of the spectrum, were more likely to work in art-related professions. Drawing on the patterns emerging from their large-scale exploratory survey, Zeman et al. (2020) proposed a broad hypothesis that, whereas hyperphantasia might be characterized by an episodic and sensorily-rich mode of thinking, aphantasia might be characterized by a more semantic and fact-oriented approach. The visual/abstract polarity in thinking styles reflected in career preferences observed by Zeman et al. (2020) is reminiscent of work on the Object-Spatial-Verbal model of cognitive styles developed by Blazhenkova & Kozhevnikov (2009) and its associated questionnaire (Object-Spatial Imagery and Verbal Questionnaire, OSIVQ). Based on behavioural and neuroimaging studies on healthy individuals (Kosslyn et al., 1995; Kozhevnikov et al., 2002; Wallace, 1990) and neuropsychological studies of brain-damaged patients (Bartolomeo, 2002; Farah et al., 1988), Blazhenkova et al. (2006) showed that visual-object imagery (imagery for colors, shapes, brightness, etc.) could be dissociated from spatial imagery (imagery for location, movement and orientation). Blazhenkova & Kozhevnikov (2009) challenged the prevailing Visualizer-Verbalizer model of cognitive styles (Paivio & Ernest, 1971; Richardson, 1977) to introduce the spatial dimension as a major form of imagery and cognitive style in its own right, alongside visual and verbal styles. They showed that several widely used paradigms, such as the Mental Rotation Task (Shepard & Metzler, 1971) or Paper Folding Test (Ekstrom, 1976), often considered visual, were not associated with visual imagery or visual cognitive styles per se, but with spatial imagery and spatial cognitive styles (Blazhenkova et al., 2006; Blazhenkova & Kozhevnikov, 2009; Kozhevnikov et al., 2010; Vannucci et al., 2006). Consistent with the observation of Zeman et al. (2020) of a prevalence of STEM occupations in aphantasia and artists in hyperphantasia, several studies on the Object-Spatial-Verbal model have shown visual-object cognitive styles to be particularly prevalent among visual artists, while spatial styles are over-represented in scientific fields and verbal styles prevail in literature and the humanities, both among students and professionals (Blazhenkova et al., 2006; Blazhenkova & Kozhevnikov, 2009, 2010; Kozhevnikov et al., 2005; Kozhevnikov et al., 2010). These results are corroborated by various studies showing that spatial imagery is preserved or enhanced in aphantasia, both on the subjective spatial scale of the Object-Spatial Imagery Questionnaire (OSIQ, the first version of the OSIVQ without the verbal scale, Blazhenkova et al., 2006) and on various spatial rotation, manipulation or spatial working memory tasks (Bainbridge et al., 2021; Dawes et al., 2020; Keogh et al., 2021; Keogh & Pearson, 2018; Pounder et al., 2022; Reeder et al., 2024; Zeman et al., 2015).
Several studies have also revealed a wide range of spatial, sensorimotor/kinaesthetic, verbal or amodal memory strategies reported by individuals with aphantasia in (supposedly) visual tasks (Keogh et al., 2021; Reeder et al., 2024; Zeman et al., 2020). The diversity in modes of thinking could therefore be distributed across several dimensions, including visual-object or spatial representation, but potentially extending to verbal and semantic domains. The verbal (or “propositional”) aspect of representations and cognitive strategies, although often mentioned as a potential candidate for alternative strategies in visual aphantasia, has scarcely been studied. Previous articles that have examined the relevance of cognitive style models for understanding aphantasia have focused on the object/spatial dissociation (Blazhenkova & Pechenkova, 2019; Palermo et al., 2022) or the visual/verbal dissociation (beranAssessingAphantasiaPrevalence2023?; takahashiDiversityAphantasiaRevealed2023?) but none so far have considered all three dimensions simultaneously. The Object-Spatial-Verbal model of cognitive styles could allow to study verbal representations in a coherent framework alongside visual and spatial imagery and shed light on the cognitive strategies of individuals with aphantasia. Therefore, the objective of the present study was two-fold: (a) to explore the cognitive profiles of individuals with aphantasia using the Object-Spatial-Verbal model of imagery and cognitive styles theorised by Blazhenkova & Kozhevnikov (2009), and (b) to explore whether the profiles might be related to cognitive performance.
We hypothesised that individuals with aphantasia would tend to adopt spatial and verbal cognitive profiles, and that these profiles would be associated with specific performance patterns. First, we hypothesised that the profiles might be related to reasoning performance. Spatial imagery is known to be involved and to play a major role in abstract reasoning (Wai et al., 2009). In this context, the absence of visual imagery in aphantasia and the priority and focus on spatial representations in aphantasia (Bainbridge et al., 2021; Keogh et al., 2021; Reeder et al., 2024) could be hypothesised to facilitate abstract reasoning. Second, we hypothesised that spatial or verbal cognitive profiles could explain individual differences in working memory performance, depending on the modality involved. Previous studies failed to find differences in working memory performance between individuals with aphantasia and controls (e.g., Keogh et al., 2021; Pounder et al., 2022; Reeder et al., 2024), but only took into account variations on the visual-object dimension of imagery. Accounting for the use of spatial and verbal representations in working memory could provide insight into the processes and strategies underlying the performance of individuals with aphantasia in various tasks (Pearson & Keogh, 2019). Third, we put forward the very general hypothesis that if individuals with aphantasia have distinct verbal cognitive profiles, they should have very good reading comprehension skills. However, some studies have established a positive correlation between reading comprehension and visual mental imagery (e.g., Suggate & Lenhard, 2022), suggesting a central role for the latter. Although similar reading habits have been observed in people with aphantasia and those with typical imagery (speedRoleVisualImagery2024?), no studies have yet been conducted on reading comprehension in an ecological context in people with aphantasia. Such research could provide a clearer picture of the advantages or disadvantages of aphantasia in complex reading tasks involving verbal skills, working memory and mental imagery. Finally, we hypothesised that the performance of individuals with aphantasia in tasks supposed to require visual imagery might be linked to a greater flexibility in switching to alternative strategies (e.g. propositional, motor, etc.). In this case, they should be characterised by particularly efficient executive functioning. Thus, the present study also included a task designed to probe executive functions.
In sum, the present study aimed to gain a better understanding of the cognitive profiles of individuals with aphantasia and their strategies for representing and processing information. We sought to identify patterns of performance in accomplishing various cognitive tasks from individuals with aphantasia and controls and relate these to their subjective preferences for visual, spatial or verbal processing. To this end, an online study was designed, integrating questionnaires and behavioural tasks to assess visual imagery, spatial imagery, verbal strategies, spatial, verbal and non-verbal reasoning, verbal and visuo-spatial working memory, reading comprehension, and executive functions. Based on previous work showing very few differences in cognitive performance between individuals with aphantasia and controls in memory tasks (Keogh et al., 2021; Knight et al., 2022; Pounder et al., 2022), we expected that dividing the participants into two groups according to visual imagery ability would not fully explain substantial differences in task performance. Thus, we planned to explore the hypothesis of hidden sub-groups within the sample using a data-driven unsupervised clustering method. This analysis was trans-categorical (including both groups) and included all measures of cognitive abilities to assess similarities and differences between participants beyond visual imagery. By trans-categorical, we refer to an approach that goes beyond predefined “diagnostic” categories to examine individual variability across continuous and multidimensional spaces. Instead of assuming that cognitive differences are fully explained by membership in an a priori group defined with a single variable (aphantasic vs. typical imagery), this approach considers profiles as overlapping and seeks latent structures or emergent clusters that cut across categories using multiple variables. For example, characteristic strengths in spatial or verbal reasoning may appear in both individuals with and without aphantasia, suggesting that these traits are not restricted to one group but distributed along continua. This framework is particularly relevant in cognitive psychology, where constructs such as imagery, memory, and reasoning interact and vary from one individual to another, regardless of predefined boundaries. The proposed data analysis plan resulted in clusters characterized by their visual, spatial, and verbal cognitive styles, which were able to explain task performance. In the light of these patterns, we then discuss the potential of the Object-Spatial-Verbal model for understanding cognitive processes and strategies in aphantasia.
2 Methods
No part of the study procedures or analysis plan was preregistered prior to the research being undertaken. We report all data exclusions, all inclusion/exclusion criteria, all manipulations, and all measures in the study.
2.1 Participants
Participants had to be French speakers, had normal or corrected vision and none of the participants reported to have any known reading disorders. They were recruited online both on groups unrelated to mental imagery (social networks, French cognitive science information network, etc.) and on groups dedicated to aphantasia and visual imagery. The study link was sent to participants who volunteered by contacting the team by email. The study was carried out following the recommendations of the French Law (Loi Jardé n◦2012- 300), in accordance with the ethical standards of the institutional research committee and with the Declaration of Helsinki and its later amendments. Informed consent was obtained from all individual participants included in the study . Participation was without compensation. As the study was exploratory, the sample size was not determined a priori. Only data from participants who completed all the tasks were included in the analyses. Participants who skipped a task extremely fast were removed from the data. Of the 1200 people who opened the link to the study, 96 completed all the tasks, making up the final sample. The questionnaire statistics are detailed in the results part below.
2.2 Materials
2.2.1 Questionnaires
The Vividness of Visual Imagery Questionnaire (VVIQ, Marks, 1973) was used to assess visual imagery ability. The VVIQ is a 16-item self-report scale that asks participants to imagine a person and several scenes and to rate the vividness of these mental images using a 5-point scale ranging from 1 (“No imagery at all, you just know you’re thinking about the object”) to 5 (“Perfectly clear and as vivid as normal vision”). Scores range from 16 to 80. The total score of 32, often used as a threshold to define aphantasia (Dawes et al., 2020; Keogh et al., 2021; e.g., dancePrevalenceAphantasiaImagery2022?; speedRoleVisualImagery2024?), is equivalent to a score of 2 (“vague and faint”) for each item in the questionnaire. The internal reliability (Cronbach’s ) of the VVIQ is .88 (McKelvie, 1995).
The Object-Spatial Imagery and Verbal Questionnaire (OSIVQ, Blazhenkova & Kozhevnikov, 2009) was used to evaluate imagery strategies and cognitive styles. The OSIVQ is a 45-item scale that asks participants to indicate the extent to which each of the statements applied to them, about visual-object imagery ability (e.g., “When I imagine a friend’s face, I have a perfectly clear and bright image”), visuo-spatial imagery ability (e.g., “My images tend to be schematic representations of things and events rather than detailed images”) or verbal strategies for processing information (e.g., “When I remember a scene, I use verbal descriptions rather than mental images”), on a 5-point scale ranging from 1 (“Totally disagree”) to 5 (“Totally agree”). Each sub-scale (object, spatial, verbal) comprises 15 items whose values are added together to obtain a score ranging from 15 to 75. Cronbach’s of the object, spatial and verbal scales are .83, .79 and .74 respectively (Blazhenkova & Kozhevnikov, 2009).
As mental imagery is a multi-sensory experience that is not limited to vision, the Plymouth Sensory Imagery Questionnaire (Psi-Q, Andrade et al., 2014) was used to assess imagery vividness across various sensory modalities. The Psi-Q (in its short form) comprises seven sets of three items for each of the following modalities: Vision, Hearing, Smell, Taste, Touch, Bodily Sensation and Emotional Feeling. Each set has a heading such as “Imagine the appearance of…”} and then three items. Participants were asked to rate their image on an 11-point scale anchored by 0 (“No image at all”) and 10 (“As vivid as real life”), thus yielding scores ranging from 0 to 33 for each modality. Cronbach’s of the 21-item Psi-Q is .91 (Andrade et al., 2014).
2.2.2 Tasks
The Raven Standard Progressive Matrices (hereinafter called Raven matrices, Raven & Court, 1938) is a widely-used assessment to estimate fluid intelligence (non-verbal visual perception ability) and abstract reasoning (analogical and deductive reasoning abilities). The Raven matrices contains 60 items divided into five sets. Each question consists in completing a missing figure in a matrix of figures by extracting and following the logical rules underlying the organisation of the matrices. Items are of increasing difficulty. At the end of a set, the difficulty decreases again but the logical rule changes, and the successive sets have increasing difficulty. A shortened clinical version with two short forms of 9 items developed by Bilker et al. (2012) was used, predicting the 60-item score with good accuracy. Each of the short forms had correlations of with the long form, and respective Cronbach’s of .80 and .83. This shortened version represents a 70% reduction in the number of items to be administered and in test-taking time, for psychometric characteristics similar to those of the full form (Bilker et al., 2012).
The Spatial Reasoning Instrument (SRI, Ramful et al., 2017) is a 30-item test for measuring spatial ability along three constructs: mental rotation, spatial orientation, and spatial visualisation. The test showed good validity an psychometric properties in three areas: (a) the exploratory factor analysis of the subscales (mental rotation, spatial orientation, spatial visualisation), (b) the Rasch analysis of item reliability within each construct, and (c) the significant correlations () and person separation reliability with four existing well-regarded instruments measuring spatial reasoning, the Card Rotation Test, the Cube Comparison Test, the Paper Folding Test [all from Ekstrom (1976)] and the Perspective Taking (Spatial Orientation) Test (Kozhevnikov & Hegarty, 2001). The internal reliability (Cronbach’s ) of the SRI is .85.
The Similarities sub-test of the Weschler Adult Intelligence Scale (WAIS-IV, Wechsler et al., 2008) is a well-known assessment to estimate verbal comprehension abilities. Specifically, this test assesses both verbal concept formation and verbal abstract reasoning. It comprises 18 pairs of words in which the participant has to identify the underlying qualitative relationship (e.g., “How are DREAM and REALITY similar?”). Accurate answers (rated according to a standardized response scale) receive two points, approximate answers one point, and vague or incorrect answers zero, giving a maximum score of 36. After three zero scores, the task stops. Due to the internet-based nature of the experiment, all participants passed all the items, but only the scoring of their answers stopped after three incorrect answers. The scoring was carried out manually, using double scoring by the first two authors of this article, blind to the groups and participants. All participants performed above the fifth percentile on the Similarities WAIS-IV sub-test (score 12/36), thereby confirming that none of the participants presented a deficit in semantic oral language skills.
Reverse Corsi blocks is a spatial memory span task (Gibeau, 2021) assessing visuo-spatial working memory. The task consists in presenting the participant with a grid of blocks in a frame, then displaying a sequence of blocks (the blocks changing colours in turn), at a rate of one per second, and asking the participant to recall it in reverse order, from the last block to the first. The task began with a short sequence of three blocks, increasing with each success or decreasing after two failures, over a fixed total of 14 trials. The average number of blocks recalled correctly at the correct position was retained as the score for the task.
The reverse digit span is a verbal memory span task assessing verbal working memory (Blackburn & Benton, 1957). The task involves presenting numbers at a rate of 1 per second, and then asking the participant to recall them from the last to the first. The task begins with a short sequence of three digits, then lengthens with each success or decreases after two failures, over a total of 14 trials. The average number of digits recalled correctly at the correct position was retained as the score for the task.
The Wisconsin Card Sorting Test (WCST, Heaton & Staff, 1993) is a widely used test of set-shifting ability which was developed to measure flexibility of human thought and the ability to shift cognitive strategy in response to changing contingencies. The WCST is designed to measure executive functioning including attentional set shifting, task/rule switching or reversal, and working memory abilities. The assessment requires the participants to sort 64 cards according to color (red, blue, yellow or green), shape (cross, circle, triangle or star) or number of figures (one, two, three or four). Over the course of the task, the sorting rule discreetly changes from color to shape or number of figures, without the participants being informed. Participants must modify their predictions and choices accordingly and sort the cards according to the new sorting rule: they receive feedback for their response (correct or incorrect), which should enable them to improve with implicit rule extraction (Nelson, 1976). The final score used was the percentage of correct sorts after 64 trials. The WCST, scored according to the percentage (or number) of correct sorts, exhibits satisfying split-half reliability (Spearman-Brown r = .90, Kopp et al., 2021).
The reading comprehension task assesses both explicit literal comprehension and inferential comprehension skills and was designed for assessment in adult readers (Brèthes et al., 2022). Reading comprehension is a complex cognitive activity that involves a number of skills including word recognition skills, grammar, semantic and general knowledge, working memory and reasoning skills as well as inference-making abilities. This reading comprehension task was composed of three texts drawn from the French daily newspaper Le Monde, all dealing with the destruction of the Great Barrier Reef and its various causes. The participant had to read each text without time constraints, then answer eight questions: four questions about explicit literal comprehension and four inferential questions about the comprehension of the implicit information in the texts, among which two examined text-connecting inferences and two examined knowledge-based inferences. While text-connecting inference skills required participants to integrate text information in order to establish local cohesiveness, knowledge-based inference skills required participants to establish links between the text content and their own personal knowledge. The questions were also divided between two question formats: open questions and multiple-choice questions. Participants were not allowed to refer to the text when answering the questions. In all, the test contained 20 questions whose answers were scored by the experimenter, with 2 points for complete answers, 1 point for incomplete answers and 0 for incorrect answers. The maximum score was therefore 40 points. The scoring was carried out manually, using double scoring by the first two authors of the present article, blind to the groups and participants. Cronbach’s of the task is 0.78.
2.3 Experimental design and procedure
The experiment was administered online via a JATOS server (Lange et al., 2015). It was programmed using SurveyJS and jsPsych (Leeuw et al., 2023), open-source JavaScript libraries dedicated to the creation of questionnaires and experiments respectively, as well as OpenSesame (Mathôt et al., 2012), a graphical interface for the construction of behavioural experiments. The link to the experiment was emailed individually to each volunteer participant and could only be used once per participant.
All participants were subjected to the same study design and task sequence. Before the first questionnaires, participants gave their consent, then demographic data were collected (first language, age, gender, occupation, education and field of study, vision). Due to the length of the protocol (Median time spent = 84.58 min, Median Absolute Deviation = 27.51 min), the experiment was structured with instructions accompanied by pages of explanations to reinforce engagement and focus (e.g., inviting people to “dive into their minds” or “test their abilities”). No text mentioned the word aphantasia, to avoid the stigma, bias or preconceived ideas specifically associated with this term (see Cabbai et al., 2023; Monzel, Dance, et al., 2023). The experiment started with the VVIQ, followed by the Raven matrices, the WCST, the OSIVQ, the SRI, the reverse Corsi blocks, the Similarities test, the Reading comprehension task, the reverse digit span, and ended with the Psi-Q. None of the tasks had a time limit, but participants were instructed to respond as soon as they had the answer while maintaining accuracy, with the aim of reducing the total duration of the experiment for them. However, given that the experiment was long, that the participants were not monitored due to the online format, and that the instructions did not place particular emphasis on speed of response as a key aspect, response times were not analysed.
2.4 Analyses
All analyses were conducted using the R statistical language (R Core Team, 2024) on RStudio (Posit team, 2025). Data curation was handled in R with packages from the tidyverse collection (Wickham et al., 2019). All visualisations were produced with the packages ggplot2 (Wickham, 2016), factoextra (Kassambara & Mundt, 2020), see (Lüdecke et al., 2021), superb (Cousineau et al., 2021) and patchwork (Pedersen, 2024).
Bayesian modelling used throughout the analyses was conducted using the R packages rstanarm (Gabry & Goodrich, 2024), BayesFactor (Morey & Rouder, 2024) and bayestestR (Makowski et al., 2019), using default weakly informative priors. The R package emmeans (Lenth, 2024) was used for marginal estimates and contrast analyses. For all tests, the statistic reported, , quantifies the relative “weight of evidence” in favour of the hypothesis (e.g., the effect of a factor), against the null hypothesis (Good, 1985). According to Jeffrey’s scale thresholds (see Kass & Raftery, 1995), = “Barely worth mentioning”; = “Substantial evidence”; = “Strong evidence”; = “Decisive evidence”. The same negative thresholds apply for the weight of evidence in favour of .
3 Results
The final sample comprised 96 participants ( = 32.5, = 11.3, range = [19, 65], 74 females, 21 males, 1 another gender). The most widely used criterion in studies on aphantasia to identify the condition is a score inferior to 32 on the VVIQ, a threshold often used in the literature (Dawes et al., 2020; Keogh et al., 2021; e.g., dancePrevalenceAphantasiaImagery2022?; speedRoleVisualImagery2024?). There were 45 individuals with aphantasia in the sample ( = 18.3, = 4.2, = 33.8, = 10.6, 37 females, 8 males) and 51 controls ( = 58.1, = 10.8, = 31.4, = 11.8, 37 females, 13 males, 1 another gender).
3.1 VVIQ groups analysis
3.1.1 Education and occupation
Participants’ level of education, field of study, and occupation were analysed to detect any association with the grouping factor. Levels of education were coded using the equivalent of the French levels in the International Standard Classification of Education (ISCED), i.e., Upper secondary, Post-secondary, Bachelor, Master, and Doctorate. Fields of study have been coded according to the 10 broad categories defined by the ISCED-F 2013 (ISCED: Fields of Education and Training). Occupations have been coded according to the sub-major groups of the International Standard Classification of Occupations (ISCO-08) for an appropriate level of precision given our sample size. Nine occupational groups were identified in the sample. Bayes factors for independence were calculated to evaluate the association between groups and each demographic variable (see Gûnel & Dickey, 1974). The tests found evidence against a relationship between groups and levels of education ( = -4.88), groups and fields of study ( = -5.41), or groups and occupation ( = -4.37).
3.1.2 Questionnaire and task results
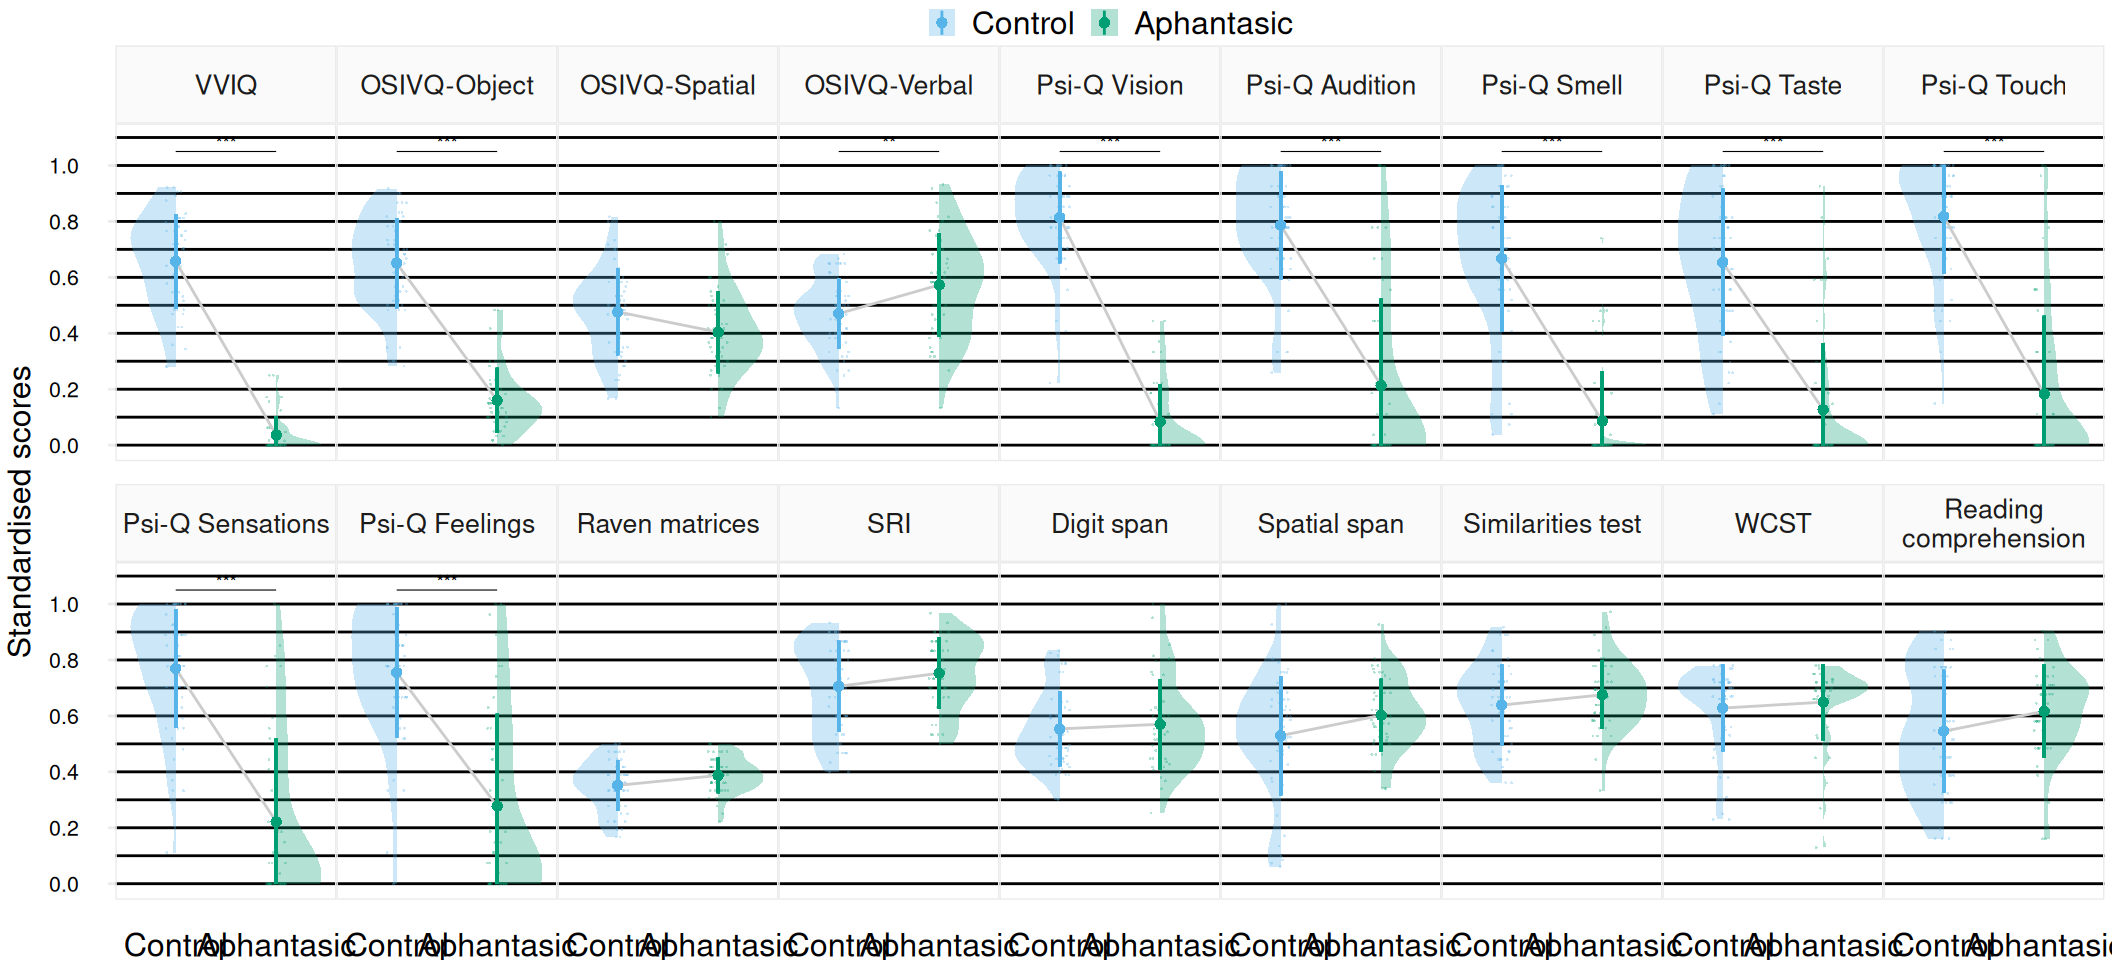
The measured variables were the scores on the VVIQ, the three OSIVQ scales, the seven Psi-Q scales, the Raven matrices, the SRI, the Similarities Test, the reverse spatial and verbal spans, the WCST and the Reading comprehension task. Linear models have been fitted to the various variables to model them with participant groups as categorical predictors and age as a continuous covariate so as to control for the potential influence of the latter. Contrast analyses were thereafter conducted to assess the differences between the groups. All score differences (hereinafter referred to as ) and their 95% Credible Intervals are reported in Table 1 along with the quantifying the weight of evidence in favour of a non-null difference between the groups.
Individuals with aphantasia had lower scores than controls in all visual imagery scales (VVIQ: = 64.33; OSIVQ-Object: = 37.94; Psi-Q Visual: = 58.94), but also on all other sensory imaging modalities evaluated by the Psi-Q ( for all modalities). All means and contrasts between the groups are represented with their distributions in Figure 1. Apart from sensory imagery, evidence was found in favour of a difference between the groups on the verbal scale of the OSIVQ, with individuals with aphantasia scoring higher than controls ( = -6.39, 95% CrI = [-10.12, -2.53], = 1.63). No differences between the groups were found on all other variables: the statistical analyses showed evidence against a difference on the spatial scale of the OSIVQ ( = -0.7), against differences in Raven matrices scores ( = -1.3), SRI scores ( = -2.2), spatial span ( = -1.01), digit span ( = -3.28), Similarities test scores ( = -2.68), Reading comprehension scores ( = -1.94) and WCST scores ( = -3.22).
The VVIQ model—i.e., the division of the sample into two VVIQ groups of individuals with aphantasia and controls—therefore had very little explanatory power on task performance. However, large inter-individual variances were observed in various outcomes, as evidenced by the spread of the outcomes’ distributions and several bimodal distributions (e.g., distributions of the OSIVQ-Verbal, SRI, or Reading comprehension scores, see Figure 1). These unexplained differences suggested the existence of an underlying structure in our sample, thus requiring a better model with more relevant groups to account for them in light of our data. We studied this hypothesis by searching for sub-groups in the sample using data-driven unsupervised clustering.
3.2 Cluster analysis
3.2.1 Correlation structure and variable selection
The selection of relevant variables for clustering is essential for good model fit and interpretation of the results (Fop & Murphy, 2018; Zakharov, 2016). Having an adequate number of dimensions (variables) for a given sample size is also crucial to increase the quality of the clustering (Psutka & Psutka, 2019). The identification and reduction of redundant variables is particularly important, so as not to distort the relative weight of each latent variable in the clustering process. If two variables represent the same concept, that concept would be represented twice in the data and hence get twice the weight as all the other variables. The final solution could be skewed in the direction of that concept, which would considerably compromise the relevance of the model for understanding variable importance (Kyriazos & Poga, 2023). In the present analysis, this issue particularly affected sensory imagery, which was represented by nine highly correlated variables (VVIQ, OSIVQ-Object, and the seven Psi-Q modalities, Pearson’s for every pairwise correlation) that were likely to reflect very similar constructs, as opposed to the remaining nine variables. Several methods exist to deal with such multicollinearity problems. In our low-dimensional setting, we chose to merge variables by averaging them to maintain interpretability while enhancing the stability of the model (Kyriazos & Poga, 2023). To choose which variables to merge, we analysed the relationships between the variables using partial correlations. Partial correlations measure the degree of association between two variables while controlling for the effect of other potentially confounding covariates (Abdi, 2007). This procedure allows to identify the strongest unbiased links between variables and prevents misinterpretation of spurious correlations.
We computed all the partial correlations between the 18 variables (see Figure 2) and chose to merge the significantly correlated variables after a Bonferroni correction (multiplying the p-values by the number of comparisons). This resulted in the creation of four new reduced variables. First, the three subscales related to visual imagery, i.e., the VVIQ, the OSIVQ-Object and Psi-Q Visual, were associated (VVIQ - Psi-Q Visual: r = 0.67, p 0.001; OSIVQ-Object - Psi-Q Visual: r = 0.36, p 0.05). They have been standardised between 0 and 1, weighted by their number of items (16, 15 and 3 respectively) and merged into a single “Visual imagery” variable to obtain as balanced a continuous measure of imagery as possible. Second, the OSIVQ-Spatial and the score of the SRI, i.e., subjective and objective spatial imagery, were associated (r = 0.36, p 0.05). They have been standardised and merged in a single “Spatial imagery” variable. Third, five Psi-Q sensory imagery subscales (Smell, Taste, Touch, Sensations and Feelings) were associated (Psi-Q Smell - Taste: r = 0.47, p 0.001; Taste - Touch: r = 0.38, p 0.05; Touch - Sensations: r = 0.41, p 0.01; Sensations - Feelings: r = 0.39, p 0.05). They have been standardised and merged into a single “Sensory imagery” variable. Fourth, the score for the Raven matrices and the Digit span were associated (r = 0.37, p 0.05). They have been standardised and merged in a common “Raven + Digit” variable. Based on the link established between the reverse digit span and measures of intellectual or executive functions (Groeger et al., 1999), we interpreted this variable theoretically as a proxy for general cognitive performance.
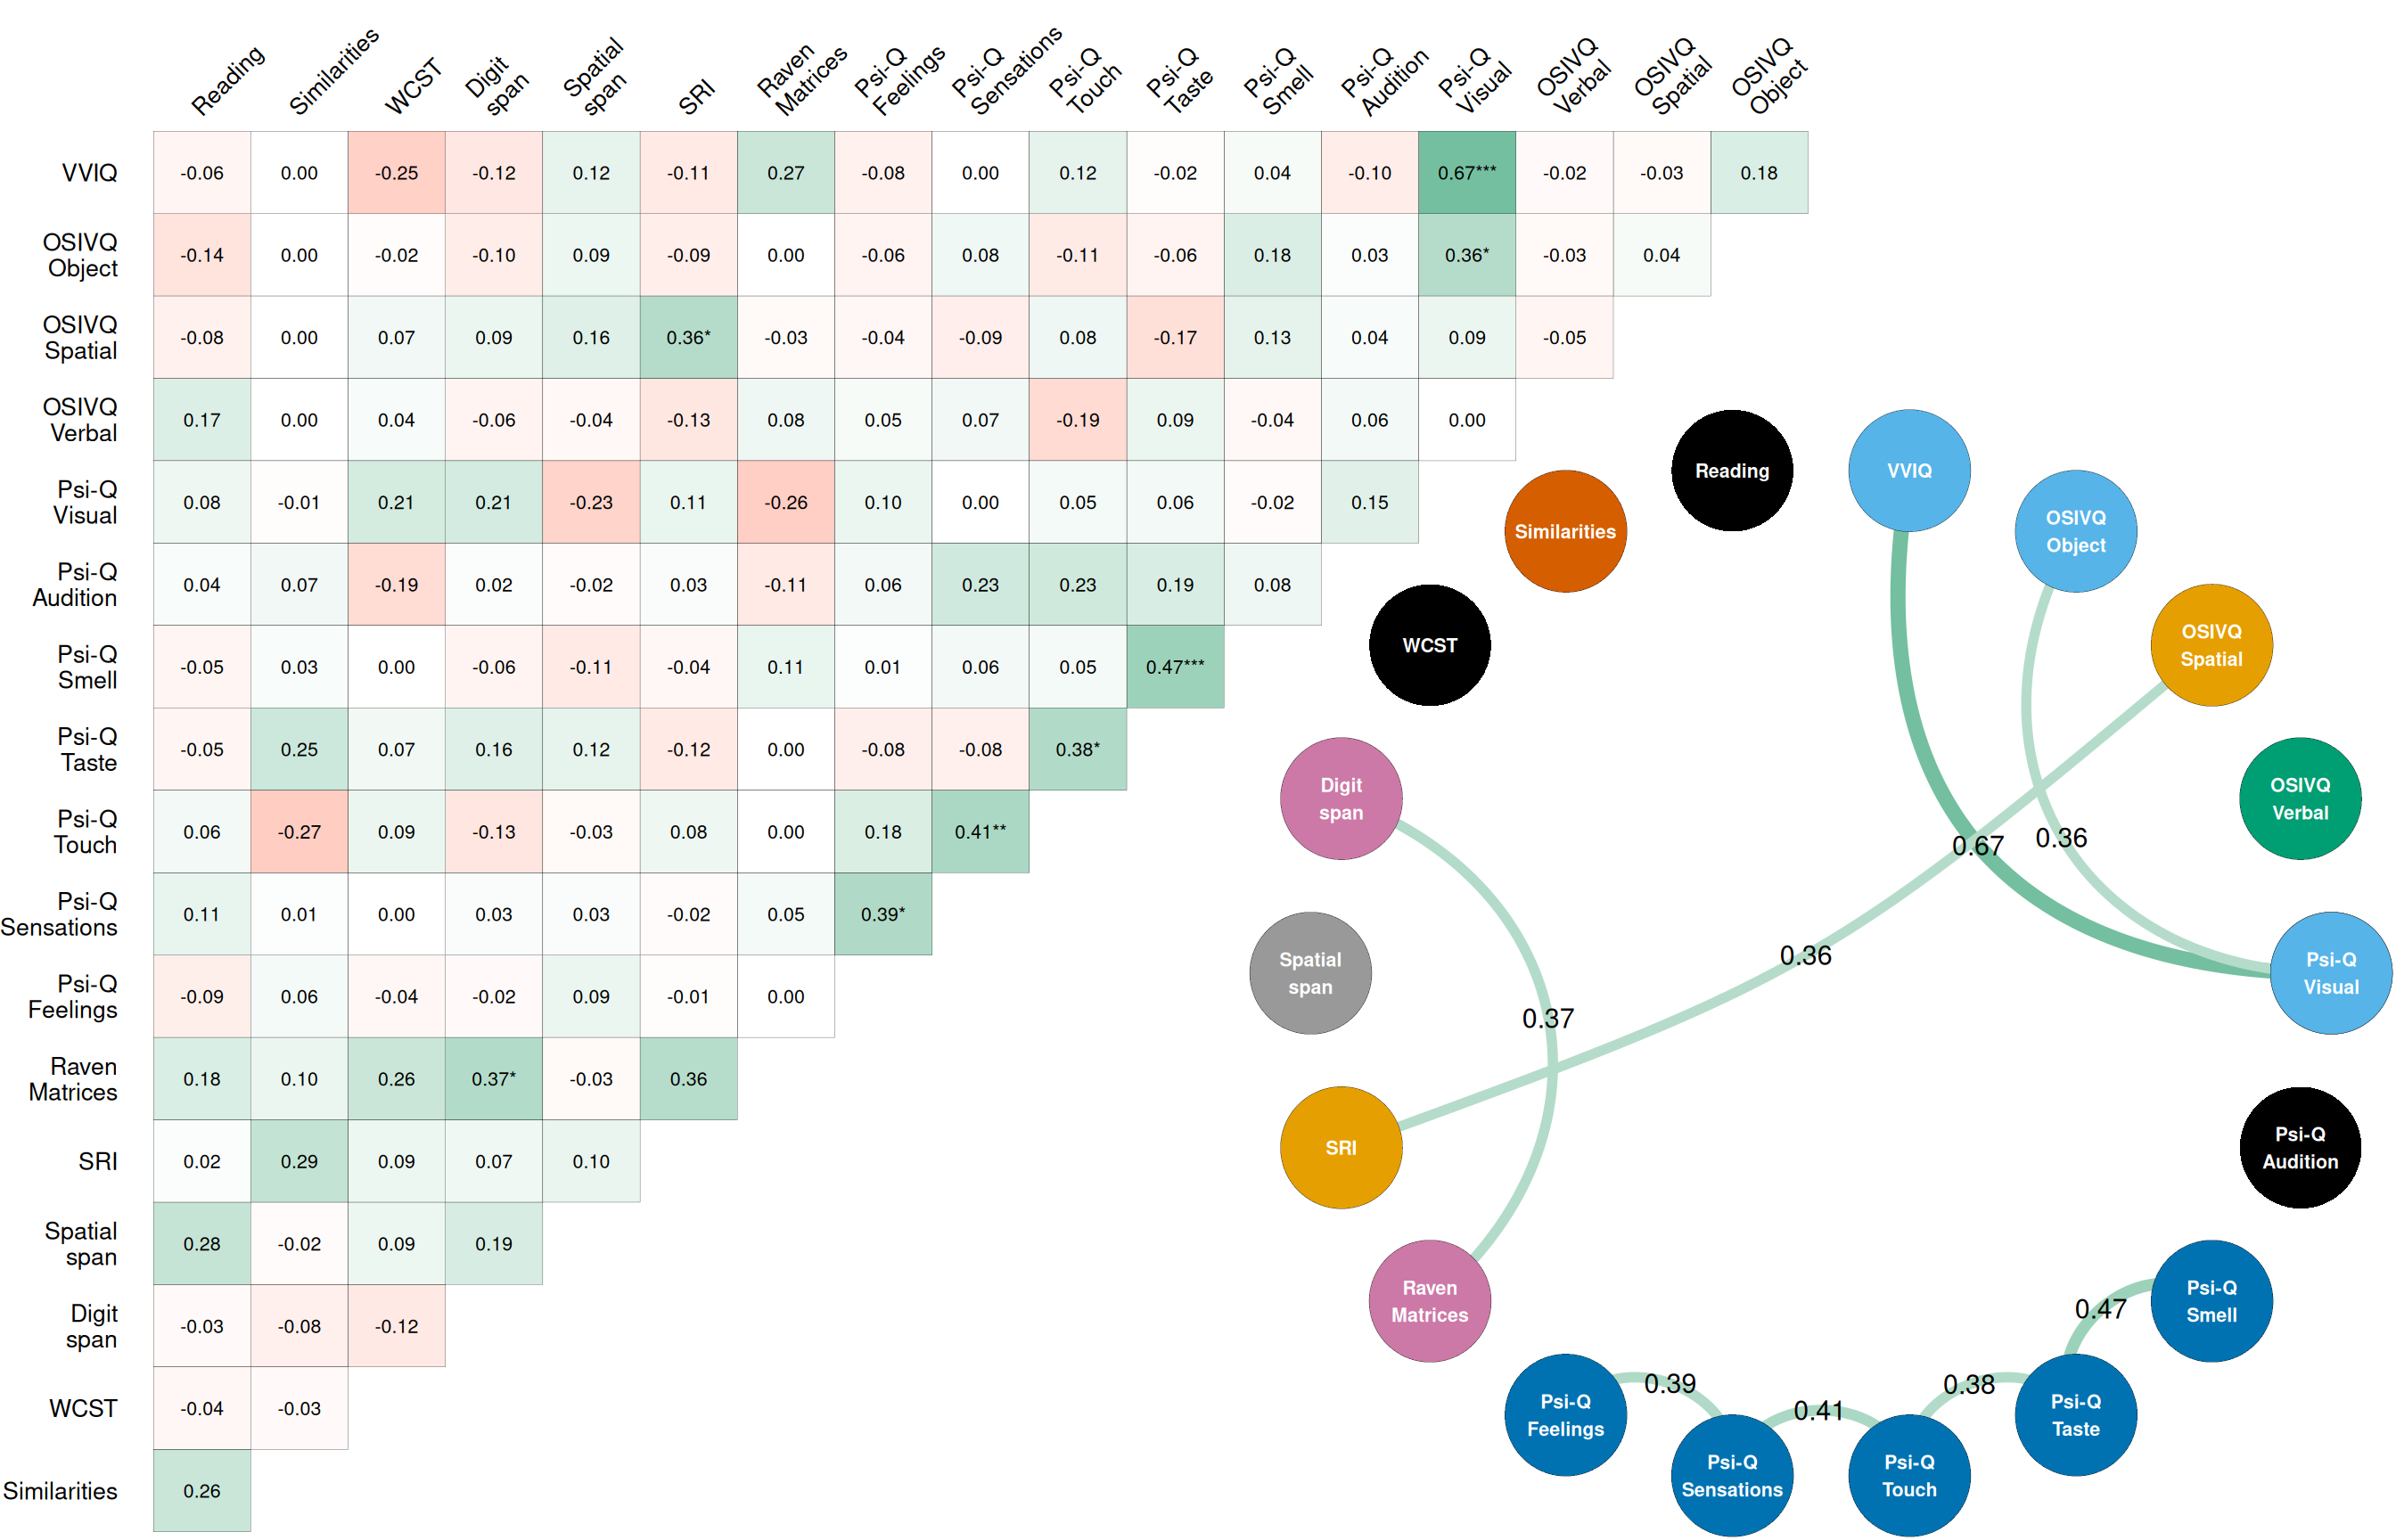
Finally, three variables were not included in the clustering. The Psi-Q Auditory was the only Psi-Q subscale that was not associated with other variables. As it comprises only three items, this variable was not included in the clustering to avoid giving it undue importance. The WCST and Reading comprehension scores were not used either, as these tasks are designed to evaluate higher-level abilities that operate at more integrated levels of cognition. Executive functioning and reading comprehension inextricably involve a mix of working memory, reasoning and attention (Heaton & Staff, 1993; Kongs et al., 2000; Suggate & Lenhard, 2022), and are likely to integrate many redundant processes with the other assessments. Instead, these variables were used a posteriori as testing variables to assess the generalisability of the cluster model to external variables, i.e., to a related sensory imagery subscale for the Psi-Q Auditory, and to complex cognitive tasks for the other two. This decision was not planned before the study, but it was decided before conducting the cluster analysis based on variable reduction and theoretical considerations.
This entire selection procedure allowed to reduce the variable space to seven dimensions, estimated by Psutka & Psutka (2019) to yield a good accuracy of parameter recovery for model-based clustering (see next section) on a sample N = 96. As a result, other variables were not modified to keep as much information as possible. For the sake of clarity, several scores have been renamed to reflect what they assess. The OSIVQ-Verbal score was identified as the propensity to use Verbal strategies for information processing, in line with the definition of this sub-scale (see Blazhenkova & Kozhevnikov, 2009). The Similarities test score was identified as a Verbal Reasoning variable. The clustering process was therefore conducted on the seven following variables: Visual imagery, Sensory imagery, Spatial imagery, Verbal strategies, Raven + Digit span, Verbal reasoning and Spatial span. To model variables using the same scale, data were normalized between 0 and 1 from their respective scales, as recommended by Zakharov (2016).
3.2.2 Model-based clustering and number of clusters
A model-based method was chosen for clustering. In this approach, clustering aims at modelling distributions with mixtures of multivariate Gaussian distributions (Steinley & Brusco, 2011). Finite Gaussian mixture models (GMM) attempt to determine the underlying population groups that produced the observed data, each cluster being a distribution with its own centre and spread. The resulting model is then used to compute the probability of each observation belonging to a cluster. Although discrete (k-means) or hierarchical clustering methods are frequently used in psychology (Zakharov, 2016), probabilistic mixture modelling approaches have proven to be more powerful and parsimonious with partially overlapping, non-spherical, multivariate normal distributions, and small sample sizes, all of which are common in psychology experiments (Dalmaijer et al., 2022).
Given that very little information is available on the clusters, the estimation of the GMM proceeds in steps, alternating between (1) estimating the posterior probability of each observation belonging to each cluster with a fixed set of parameters and (2) updating the estimates of the parameters by fixing the probability of cluster membership for each observation (Steinley & Brusco, 2011). This iterative procedure continues until the model converges on stable clusters. The standard method for this estimation is the expectation-maximisation algorithm (EM, Dempster et al., 1977)1. In the present study, the mclust R package (Scrucca et al., 2023) was used to conduct GMM clustering. The estimation procedure for the mixture of clusters in the GMM requires knowledge of the number of clusters and their distributional form. The determination of these parameters was done using the Bayesian Information Criterion (BIC) implemented in the mclust package.
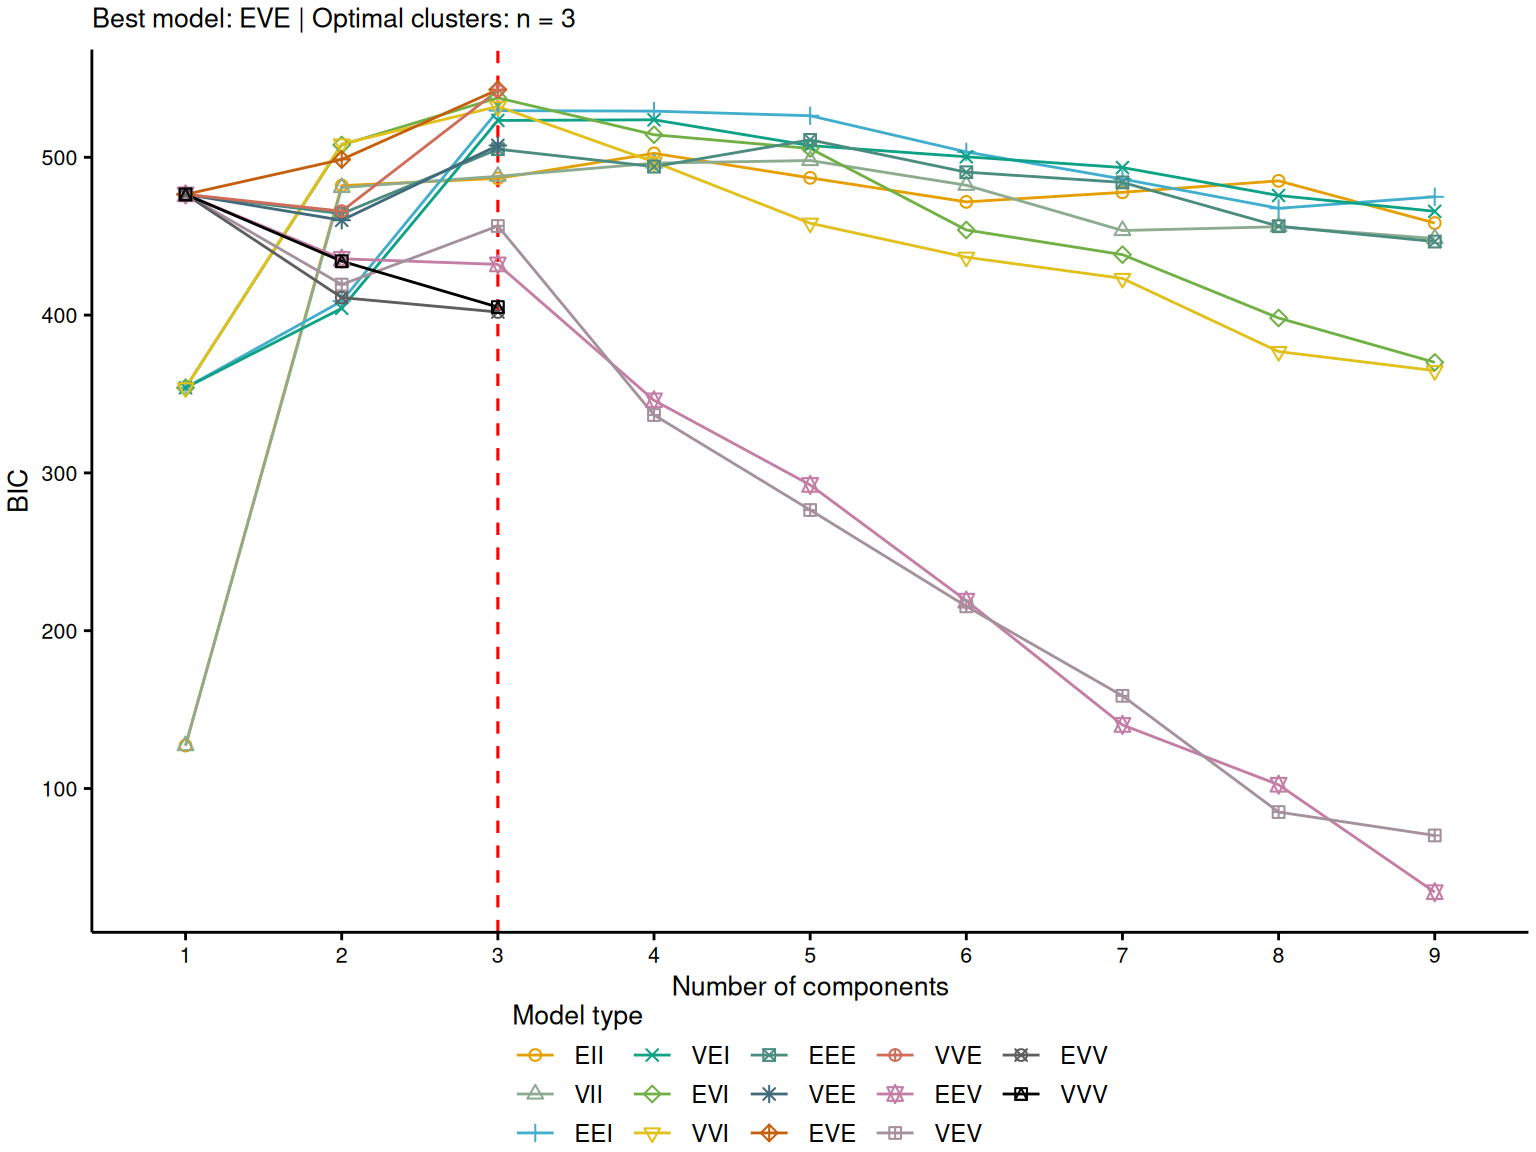
There are no generally accepted rules regarding minimum sample sizes in clustering procedures. For model-based clustering procedures Dalmaijer et al. (2022) recommended N = 20 to N = 30 per expected cluster with medium to large effect sizes (i.e., cluster separation), which would translate into two to four clusters in our sample. Given the present dataset, the comparison of various GMM types with different number of clusters using the BIC showed that the best solution was a model with three ellipsoidal clusters of varying shapes, equal volume and orientations (EVE model, see Figure 3).
3.2.3 Clustering results
The profiles of the three clusters obtained are presented in Figure 4 (left panel). Cluster A was made up exclusively of individuals with aphantasia ( = 32), Cluster B was mixed ( = 30), comprising 17 controls and 13 individuals with aphantasia, while Cluster C was composed solely of control participants ( = 34). Bayes factors for independence found no association between clusters and levels of education ( = -7.44), clusters and fields of study ( = -6.06), or clusters and occupation ( = -3.88).
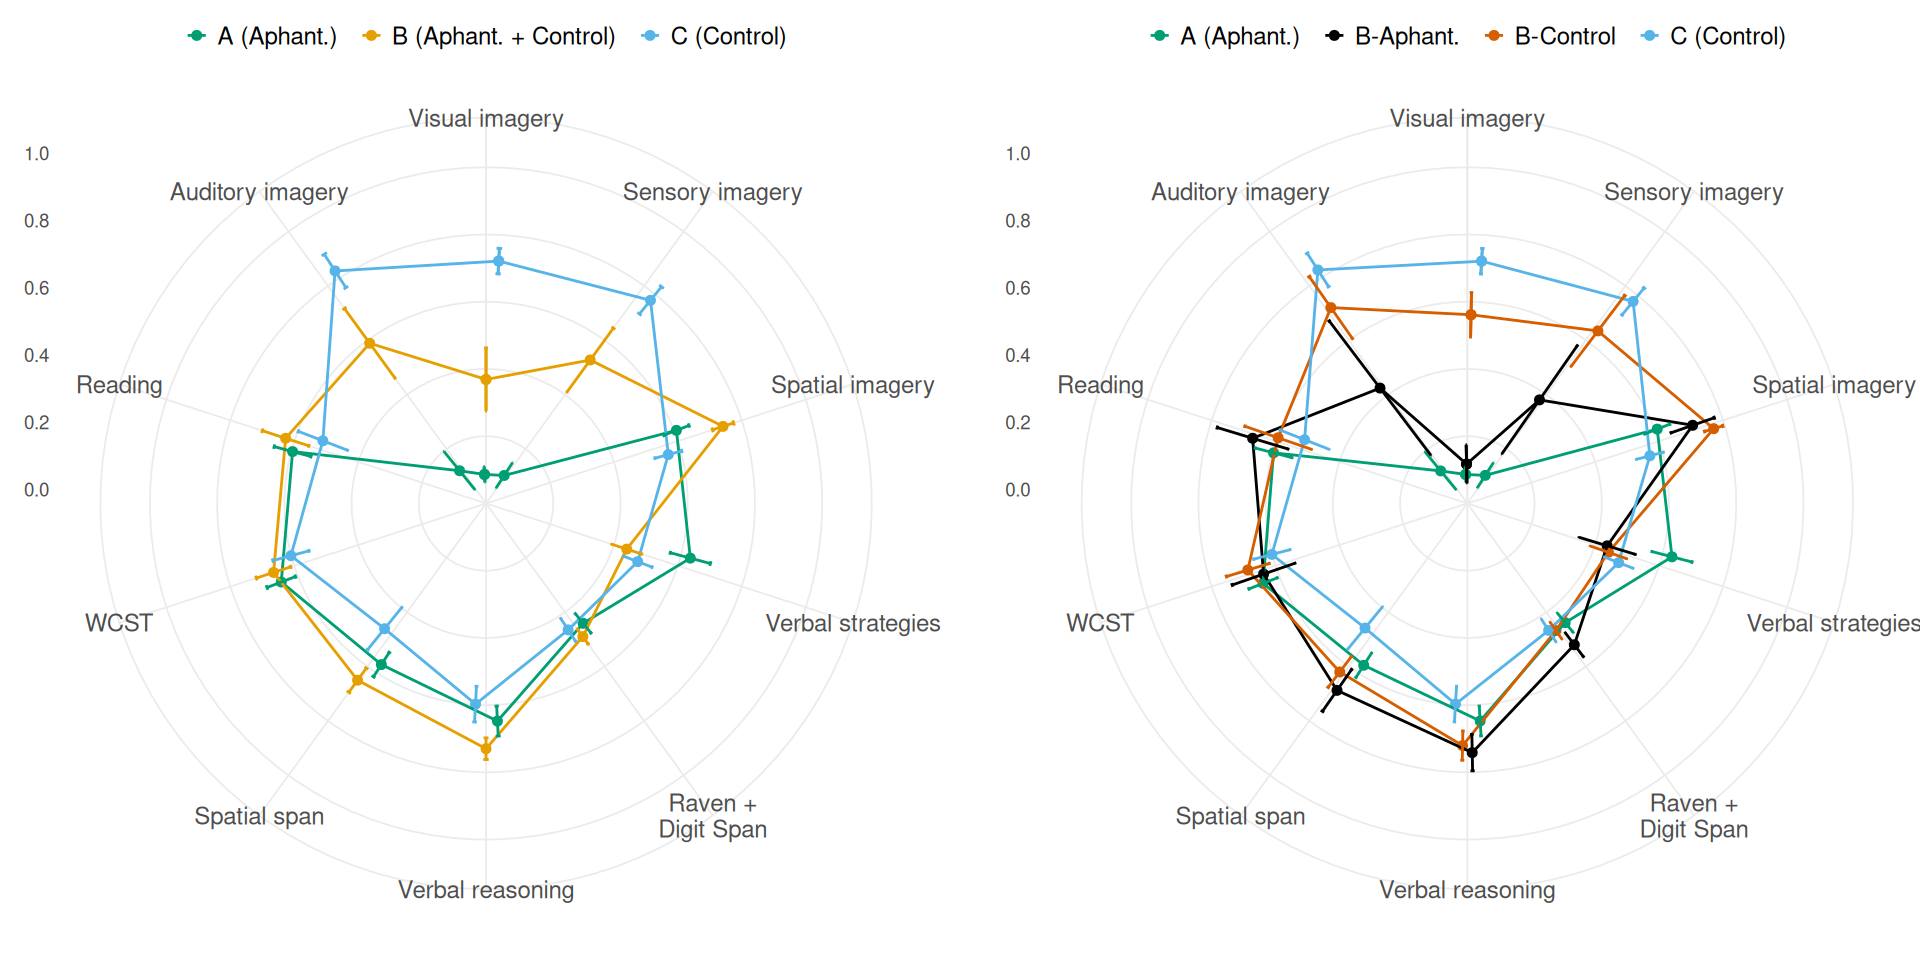
Cluster scores were modelled with the clusters as predictors using the same linear Bayesian modelling as described above for modelling variables with the groups. All detailed pairwise differences between the clusters and their 95% Credible Intervals are reported in Table 2 along with weights of evidence in favour of differences between clusters. The three clusters had very distinctive features on the visual, sensory, spatial and verbal dimensions of their cognitive profiles. As seen, for Visual and Sensory imagery, Controls (cluster C) had much higher scores than the mixed cluster (cluster B) which itself had higher scores than the Aphantasic cluster (cluster A; all 3.99). Cluster B had higher scores than the other two clusters in Spatial imagery (both 5.52), which did not differ from each other ( = -1.74). In turn, cluster A had higher scores than the other two in Verbal strategies (both 4.31), for which B and C did not differ ( = -3.19). Else, cluster B outperformed cluster C in verbal reasoning and spatial span (both 3.33), but no differences were found between cluster A and the other two on these scores (all 0.16). Finally, for the Raven + Digit span variable, the differences between the clusters were negligible (all -2.2).
We also modelled the variables excluded from the clustering procedure, i.e., Auditory imagery, WCST and reading comprehension scores, to assess how the cluster patterns transferred to external variables. They are seen at the bottom of Table 2. The imagery patterns were maintained for Auditory imagery, where cluster C scored higher than B ( = 2.33), which in turn scored higher than A ( = 11.37). However, although the mean cluster scores on the WCST and reading comprehension followed the same trend as the other cognitive tasks (i.e. B A C — WCST: () = 0.66 (0.14); () = 0.65 (0.13); () = 0.6 (0.16) — Reading comprehension: () = 0.63 (0.2); () = 0.6 (0.16); () = 0.52 (0.23)), there was evidence for an absence of differences between clusters (highest = -1.26).
Dividing the controls and individuals with aphantasia within cluster B into two “sub-clusters” provided further insights on the profiles in the sample (see Figure 4, right panel; details of all 60 pairwise comparisons can be found in the extended analysis report on the OSF at https://osf.io/7vsx6/). This allowed to assess imagery differences that might have been biased by averaging imagery scores in this mixed cluster. First, comparisons between controls from B (noted ) and from C showed that C had higher visual imagery than ( = 6.96), but comparable sensory imagery ( = -0.78) and auditory imagery scores ( = -2.36). As observed above, B-Controls had higher spatial imagery ( = 9.56), spatial span ( = 1.53) and verbal reasoning scores ( = 0.76), but no differences in verbal strategies ( = -3.31) or Raven + Digit span ( = -3.35). These comparisons show that the main imagery differences between the B and C controls lie in visual and spatial imagery, indicating that the differences in performance observed in the tasks could be related to the balance between the two, a high visual imagery being associated with lower performance.
Last, comparisons between individuals with aphantasia from A and from B (noted ) confirmed their differences in verbal strategies in favour of A ( = 3.79), and in spatial imagery in favour of ( = 1.16), along with an absence of differences in Raven + Digit span ( = -0.88), spatial span ( = -2.02), and verbal reasoning ( = -1.18). However, the contrasts also revealed that, although the two had comparable visual imagery ( = -4.02), had higher sensory imagery than A ( = 2.46). This difference also existed in auditory imagery ( = 1.35), which was not used as a variable for clustering. The differences in verbal strategies, spatial imagery, sensory and auditory imagery between A and aphants point to the existence of aphantasia subgroups with major mental imagery and cognitive style differences extending beyond visual imagery.
4 Discussion
The present study investigated the cognitive profiles of individuals with and without aphantasia and how these profiles influence their performance on various cognitive tasks. To this end, we examined key aspects of subjective experiences, including visual and sensory imagery, spatial imagery, and verbal strategies, using questionnaires. Additionally, reasoning, working memory, executive functioning, and reading comprehension were assessed through a battery of behavioural tasks.
The initial analyses, comparing individuals with aphantasia to controls based on conventional measures, revealed few significant differences in performance. While individuals with aphantasia demonstrated reduced sensory imagery and a stronger reliance on verbal strategies, differences in spatial imagery and other cognitive tasks, such as reasoning or memory, were minimal. These findings aligned with previous research emphasizing the limited impact of aphantasia in many behavioural tasks (e.g., Bainbridge et al., 2021; Keogh et al., 2021; Knight et al., 2022; Pounder et al., 2022). However, a clustering analysis using a Gaussian Mixture Model (GMM) identified a cluster structure within the dataset. By leveraging variables related to visual, sensory, and spatial imagery, verbal strategies, and cognitive abilities (i.e., Raven matrices, digit span, spatial span, and verbal reasoning), the algorithm suggested the presence of three distinct cognitive profiles, each with unique characteristics in visual, sensory, and spatial imagery, as well as verbal strategies. One cluster, exclusively composed of controls, demonstrated high visual and sensory imagery, strongly relying on visual-object representations. Another mixed cluster, including both individuals with aphantasia and controls, exhibited strong spatial imagery and performed best on spatial span and verbal reasoning tasks. The final cluster consisted entirely of individuals with aphantasia, who displayed multisensory aphantasia (reduced sensory, auditory, and visual imagery) and a reliance on verbal strategies. This clustering revealed complex, multidimensional patterns of cognitive abilities and imagery preferences that extended beyond the binary categorization of aphantasia versus control, offering a rich and nuanced picture of the relationships between mental imagery and cognition.
If we focus only on the Control participants, the cluster analyses revealed important subgroup distinctions. Controls could be divided into two subgroups: one with highly vivid visual imagery but reduced spatial imagery (cluster C) and another with the opposite pattern, characterized by stronger spatial imagery (cluster ). These distinctions held important implications for task performance. Individuals with higher spatial imagery outperformed their counterparts with stronger visual imagery in tasks requiring reasoning and working memory, such as spatial span and verbal reasoning tasks. Interestingly, both groups performed similarly on tasks involving non-verbal reasoning (Raven matrices) and reverse digit span, suggesting that the observed differences were not due to overall disparities in cognitive ability but were specific to differences in imagery style. These results emphasize the importance of spatial imagery in abstract reasoning and suggest that vivid visual imagery may sometimes impede these processes. This is consistent with the “visual imagery impedance hypothesis” (Knauff & Johnson-Laird, 2002), which posits that overly detailed visual representations can disrupt reasoning by introducing irrelevant information. These findings not only reinforce the relevance of spatial imagery in cognitive profiles but also raise questions about its relationship with visual imagery, highlighting potential trade-offs between visual and spatial imagery capacities, a dynamic previously suggested by Kozhevnikov et al. (2010).
The clustering approach also revealed important heterogeneity within the group of individuals with aphantasia. While a shared absence of visual imagery defined all participants with aphantasia, two distinct subgroups emerged: one that relied heavily on spatial strategies (“spatialisers”) and another that depended predominantly on verbal processing (“verbalisers”). Spatialisers demonstrated preserved sensory and auditory imagery and demonstrated strong performance in tasks that emphasized spatial representation, such as mental rotation and spatial manipulation tasks. Verbalisers, by contrast, exhibited what could be described as “multisensory aphantasia” reporting not only the absence of visual imagery but also reduced or absent sensory and auditory imagery. This group relied heavily on verbal strategies, with a preference for linguistic forms of information processing. The distinction between “multisensory aphantasia” and “visual-only aphantasia” aligns with a prior clustering study conducted by Dawes et al. (2023), which highlighted the heterogeneity of aphantasia across larger samples. However, our findings show another relevant dimension by linking these aphantasia profiles to different cognitive styles: verbal versus spatial. The strong performance of spatialisers on spatial tasks supports prior work suggesting that many classic “mental imagery tasks”, such as the Mental Rotation Task (Shepard & Metzler, 1971), or the Paper Folding Test (Ekstrom, 1976) rely more heavily on spatial than visual-object imagery (Blazhenkova & Kozhevnikov, 2009; Bled & Bouvet, 2021; Borst & Kosslyn, 2010; Haciomeroglu, 2016; e.g., Kozhevnikov et al., 2005; Kozhevnikov et al., 2010). Furthermore, these findings on cognitive styles provide insights into why individuals with aphantasia perform well on spatial reasoning tasks, echoing earlier work on the amodal nature of spatial representations (Johnson-Laird, 2010) and spatial imagery in aphantasia (Palermo et al., 2022). Nuances in spatial imagery and cognitive styles among individuals with aphantasia may also be related to the presence or absence of unconscious visual representations, a phenomenon currently debated in the literature (see Krempel & Monzel, 2024; Muraki et al., 2023; Purkart et al., 2024). In this respect, unsupervised clustering could unveil previously unrecognised heterogeneities within visual imagery groups, offering novel insights into the cognitive architectures underlying mental representations.
The spatial and verbal profiles observed in aphantasia profiles could also have broader implications beyond cognitive processes and task performance. Zeman et al. (2020) have noted a disproportionate representation of individuals with aphantasia in STEM fields, which may reflect the influence of these spatial profiles among individuals with visual aphantasia. Indeed, numerous studies on the associations between the OSIVQ and categories of occupation, study and activity have found correlations between the three visual-object, spatial and verbal dimensions and areas of specialisation in visual arts, science and humanities, respectively (for an extended review, see Blazhenkova & Pechenkova, 2019). These patterns suggest that cognitive profiles encompassing spatial and verbal dimensions could be relevant to understand the consequences of aphantasia in ecological contexts, as supported by recent findings linking OSIVQ-derived profiles to real-world problem-solving abilities (Chkhaidze et al., 2023; Höffler et al., 2017). Aphantasia may represent one extreme among many in a larger, multidimensional cognitive spectrum, where individual differences in imagery and cognitive style influence both cognitive abilities, subjective experience and daily life.
Since the first systematic investigation of aphantasia (Zeman et al., 2015), individuals with this condition have reported “compensatory strengths in verbal, mathematical and logical domains”, but our understanding of these cognitive strengths and weaknesses associated with aphantasia remains incomplete. While the profiles identified in this study offer a potential framework to explore these compensatory mechanisms further, several limitations must be acknowledged. The use of an unsupervised clustering algorithm allowed for the discovery of hidden structures in the data, but the findings remain exploratory and require replication in larger, more diverse samples. Although the use of a trans-categorical approach (clustering on a mixed sample of people with aphantasia or typical imagery) allowed us to reveal relevant dimensions of cognitive profiles, there may be more nuanced patterns in aphantasia that this study was unable to capture due to the sample size. Moreover, the tasks used to assess mental imagery and reasoning were selected to provide broad coverage of cognitive abilities but may not have captured the full complexity of these constructs. Future research should aim to refine the measurement of visual, spatial, and verbal imagery through the use of tasks specifically designed to disentangle these dimensions. For instance, in relation to the OSIVQ, the Degraded Pictures Task (Blazhenkova & Kozhevnikov, 2009; Kozhevnikov et al., 2005; Kozhevnikov et al., 2010), the Paper Folding Test (Blazhenkova & Kozhevnikov, 2009; Haciomeroglu, 2016; Höffler et al., 2017; Kozhevnikov et al., 2005) and vocabulary tasks (Blazhenkova & Kozhevnikov, 2009; Bled & Bouvet, 2021) have been shown to correlate with object, spatial and verbal scores, respectively. Furthermore, it remains to be seen whether the profiles identified here can be validated with other behavioural and neural phenomena, such as differences in brain activity during visual or spatial imagery tasks.
Overall, the findings of this study suggest that variations in visual, spatial, and verbal cognitive styles offer a rich framework for understanding the “phantasia continuum”. This framework not only highlights the heterogeneity within the aphantasia population but also situates aphantasia within a broader spectrum of cognitive abilities. Ultimately, by moving beyond the binary classification of aphantasia and exploring the multidimensional nature of cognitive profiles, this study aims to contribute to a more nuanced and cohesive understanding of the diversity of mental imagery and its cognitive implications. In turn, the spectacular variability in inner experiences represents an invaluable source of information into mental representations, which could answer long-standing questions about their nature, from their modal and amodal properties to their interaction with fundamental processes such as reasoning, problem-solving or working memory.
Research transparency statement
All the following elements required to reproduce the study and analyses are publicly available on the Open Science Framework (https://osf.io/7vsx6/): all online study materials; all anonymised primary data and pre-processed data; all analysis code and notebooks with extensive commentary and supplementary information on the exploratory analysis process and results. No artificial intelligence assisted technologies were used in this research or the creation of this article.
Author contributions
Conceptualisation: MD, ST, EC, GP. Data curation: MD. Formal analysis: MD. Funding acquisition: GP. Investigation: MD, ST. Methodology: MD, ST, DC, EC, GP. Project administration: GP, EC. Resources: MD, ST, EC, DC. Software: MD. Supervision: GP, EC. Visualisation: MD. Writing - Original Draft Preparation: MD. Writing - Review & Editing: GP, DC, EC.
Declaration of interests
None.
References
Abdi, H. (2007). Part (semi partial) and partial regression coefficients. Encyclopedia of Measurement and Statistics, 3, 1–9.
Andrade, J., May, J., Deeprose, C., Baugh, S.-J., & Ganis, G. (2014). Assessing vividness of mental imagery: The plymouth sensory imagery questionnaire. British Journal of Psychology, 105(4), 547–563. https://doi.org/10.1111/bjop.12050
Bainbridge, W. A., Pounder, Z., Eardley, A. F., & Baker, C. I. (2021). Quantifying aphantasia through drawing: Those without visual imagery show deficits in object but not spatial memory. Cortex, 135, 159–172. https://doi.org/10.1016/j.cortex.2020.11.014
Bartolomeo, P. (2002). The relationship between visual perception and visual mental imagery: A reappraisal of the neuropsychological evidence. Cortex, 38(3), 357–378. https://doi.org/10.1016/S0010-9452(08)70665-8
Bilker, W. B., Hansen, J. A., Brensinger, C. M., Richard, J., Gur, R. E., & Gur, R. C. (2012). Development of abbreviated nine-item forms of the raven’s standard progressive matrices test. Assessment, 19(3), 354–369. https://doi.org/10.1177/1073191112446655
Blackburn, H. L., & Benton, A. L. (1957). Revised administration and scoring of the digit span test. Journal of Consulting Psychology, 21(2), 139.
Blazhenkova, O., & Kozhevnikov, M. (2009). The new object-spatial-verbal cognitive style model: Theory and measurement. Applied Cognitive Psychology, 23(5), 638–663. https://doi.org/10.1002/acp.1473
Blazhenkova, O., & Kozhevnikov, M. (2010). Visual-object ability: A new dimension of non-verbal intelligence. Cognition, 117(3), 276–301. https://doi.org/10.1016/j.cognition.2010.08.021
Blazhenkova, O., Kozhevnikov, M., & Motes, M. A. (2006). Object and spatial imagery: Distinctions between members of different professions. Cognitive Processing, 7(1), 20–21. https://doi.org/10.1007/s10339-006-0047-9
Blazhenkova, O., & Pechenkova, E. (2019). The two eyes of the blind mind: Object vs. Spatial aphantasia? Russian Journal of Cognitive Science, 6(44), 51–65. http://dx.doi.org/10.47010/19.4.5
Bled, C., & Bouvet, L. (2021). Validation of the french version of the object spatial imagery and verbal questionnaire. European Review of Applied Psychology, 71(4), 100687. https://doi.org/10.1016/j.erap.2021.100687
Borst, G., & Kosslyn, S. M. (2010). Individual differences in spatial mental imagery. Quarterly Journal of Experimental Psychology, 63(10), 2031–2050. https://doi.org/10.1080/17470211003802459
Brèthes, H., Cavalli, E., Denis-Noël, A., Melmi, J.-B., El Ahmadi, A., Bianco, M., & Colé, P. (2022). Text reading fluency and text reading comprehension do not rely on the same abilities in university students with and without dyslexia. Frontiers in Psychology, 13. https://doi.org/10.3389/fpsyg.2022.866543
Cabbai, G., Dance, C., Dienes, Z., Simner, J., Forster, S., & Lush, P. (2023). Investigating relationships between trait visual imagery and phenomenological control: The role of context effects.
Chkhaidze, A., Coulson, S., & Kiyonaga, A. (2023). Individual differences in preferred thought formats predict features of narrative recall. PsyArXiv. https://doi.org/10.31234/osf.io/xmf7w
Cousineau, D., Goulet, M.-A., & Harding, B. (2021). Summary plots with adjusted error bars: The superb framework with an implementation in R. Advances in Methods and Practices in Psychological Science, 4(3), 1–46. https://doi.org/10.1177/25152459211035109
Dalmaijer, E. S., Nord, C. L., & Astle, D. E. (2022). Statistical power for cluster analysis. BMC Bioinformatics, 23(1), 205. https://doi.org/10.1186/s12859-022-04675-1
Dance, C. J., Ward, J., & Simner, J. (2021). What is the link between mental imagery and sensory sensitivity? Insights from aphantasia. Perception, 50(9), 757–782. https://doi.org/10.1177/03010066211042186
Dawes, A., Keogh, R., Andrillon, T., & Pearson, J. (2020). A cognitive profile of multi-sensory imagery, memory and dreaming in aphantasia. Scientific Reports, 10(11), 10022. https://doi.org/10.1038/s41598-020-65705-7
Dawes, A., Keogh, R., & Pearson, J. (2023). Multisensory subtypes of aphantasia: Mental imagery as supramodal perception in reverse. Neuroscience Research. https://doi.org/10.1016/j.neures.2023.11.009
Dawes, A., Keogh, R., Robuck, S., & Pearson, J. (2022). Memories with a blind mind: Remembering the past and imagining the future with aphantasia. Cognition, 227, 105192. https://doi.org/10.1016/j.cognition.2022.105192
Dempster, A. P., Laird, N. M., & Rubin, D. B. (1977). Maximum likelihood from incomplete data via the EM algorithm. Journal of the Royal Statistical Society: Series B (Methodological), 39(1), 1–22.
Dupont, W., Papaxanthis, C., Madden-Lombardi, C., & Lebon, F. (2024). Explicit and implicit motor simulations are impaired in individuals with aphantasia. Brain Communications, 6(2), fcae072.
Ekstrom, R. B. (1976). Kit of factor-referenced cognitive tests. Educational Testing Service.
Farah, M. J., Levine, D. N., & Calvanio, R. (1988). A case study of mental imagery deficit. Brain and Cognition, 8(2), 147–164. https://doi.org/10.1016/0278-2626(88)90046-2
Fop, M., & Murphy, T. B. (2018). Variable selection methods for model-based clustering. Statistics Surveys, 12(none), 18–65. https://doi.org/10.1214/18-SS119
Gabry, J., & Goodrich, B. (2024). Rstanarm: Bayesian applied regression modeling via stan. https://mc-stan.org/rstanarm/
Gibeau, R.-M. (2021). The corsi blocks task: Variations and coding with jsPsych. The Quantitative Methods for Psychology, 17(3), 299–311. https://doi.org/10.20982/tqmp.17.3.p299
Good, I. J. (1985). Weight of evidence: A brief survey. Bayesian Statistics, 2, 249–270.
Groeger, J. A., Field, D., & Hammond, S. M. (1999). Measuring memory span. International Journal of Psychology, 34(5-6), 359–363. https://doi.org/10.1080/002075999399693
Gûnel, E., & Dickey, J. (1974). Bayes factors for independence in contingency tables. Biometrika, 61(3), 545–557. https://doi.org/10.1093/biomet/61.3.545
Haciomeroglu, E. S. (2016). Object-spatial visualization and verbal cognitive styles, and their relation to cognitive abilities and mathematical performance. Educational Sciences: Theory and Practice, 16(3), 987–1003. https://eric.ed.gov/?id=EJ1115147
Heaton, R. K., & Staff, P. A. R. (1993). Wisconsin card sorting test: Computer version 2. Odessa: Psychological Assessment Resources, 4, 1–4.
Höffler, T. N., Koć-Januchta, M., & Leutner, D. (2017). More evidence for three types of cognitive style: Validating the object-spatial imagery and verbal questionnaire using eye tracking when learning with texts and pictures. Applied Cognitive Psychology, 31(1), 109–115. https://doi.org/10.1002/acp.3300
Johnson-Laird, P. N. (2010). Mental models and human reasoning. Proceedings of the National Academy of Sciences, 107(43), 18243–18250. https://doi.org/10.1073/pnas.1012933107
Kass, R. E., & Raftery, A. E. (1995). Bayes factors. Journal of the American Statistical Association, 90(430), 773–795. https://doi.org/10.1080/01621459.1995.10476572
Kassambara, A., & Mundt, F. (2020). Factoextra: Extract and visualize the results of multivariate data analyses. http://www.sthda.com/english/rpkgs/factoextra
Keogh, R., & Pearson, J. (2018). The blind mind: No sensory visual imagery in aphantasia. Cortex, 105, 53–60. https://doi.org/10.1016/j.cortex.2017.10.012
Keogh, R., Wicken, M., & Pearson, J. (2021). Visual working memory in aphantasia: Retained accuracy and capacity with a different strategy. Cortex, 143, 237–253. https://doi.org/10.1016/j.cortex.2021.07.012
Keogh, R., Wicken, M., & Pearson, J. (2023). Fewer intrusive memories in aphantasia: Using the trauma film paradigm as a laboratory model of PTSD.
Knauff, M., & Johnson-Laird, P. N. (2002). Visual imagery can impede reasoning. Memory & Cognition, 30(3), 363–371. https://doi.org/10.3758/BF03194937
Knight, K. F., Milton, F. N., & Zeman, A. (2022). Memory without imagery: No evidence of visual working memory impairment in people with aphantasia. Proceedings of the Annual Meeting of the Cognitive Science Society, 44, 8.
Kongs, S. K., Thompson, L. L., Iverson, G. L., & Heaton, R. K. (2000). WCST-64: Wisconsin card sorting test- 64 card version, professional manual. PAR.
Kopp, B., Lange, F., & Steinke, A. (2021). The reliability of the wisconsin card sorting test in clinical practice. Assessment, 28(1), 248–263. https://doi.org/10.1177/1073191119866257
Kosslyn, S. M., Behrmann, M., & Jeannerod, M. (1995). The cognitive neuroscience of mental imagery. Neuropsychologia, 33(11), 1335–1344. https://doi.org/10.1016/0028-3932(95)00067-D
Kozhevnikov, M., Blazhenkova, O., & Becker, M. (2010). Trade-off in object versus spatial visualization abilities: Restriction in the development of visual-processing resources. Psychonomic Bulletin & Review, 17(1), 29–35. https://doi.org/10.3758/PBR.17.1.29
Kozhevnikov, M., & Hegarty, M. (2001). A dissociation between object manipulation spatial ability and spatial orientation ability. Memory & Cognition, 29(5), 745–756. https://doi.org/10.3758/BF03200477
Kozhevnikov, M., Hegarty, M., & Mayer, R. E. (2002). Revising the visualizer-verbalizer dimension: Evidence for two types of visualizers. Cognition and Instruction, 20(1), 47–77. http://www.jstor.org/stable/3233862
Kozhevnikov, M., Kosslyn, S., & Shephard, J. (2005). Spatial versus object visualizers: A new characterization of visual cognitive style. Memory & Cognition, 33(4), 710–726. https://doi.org/10.3758/BF03195337
Krempel, R., & Monzel, M. (2024). Aphantasia and involuntary imagery. Consciousness and Cognition, 120, 103679. https://doi.org/10.1016/j.concog.2024.103679
Kyriazos, T., & Poga, M. (2023). Dealing with multicollinearity in factor analysis: The problem, detections, and solutions. Open Journal of Statistics, 13(33), 404–424. https://doi.org/10.4236/ojs.2023.133020
Lange, K., Kühn, S., & Filevich, E. (2015). "Just another tool for online studies” (JATOS): An easy solution for setup and management of web servers supporting online studies. PLOS ONE, 10(6), e0130834. https://doi.org/10.1371/journal.pone.0130834
Leeuw, J. R. de, Gilbert, R. A., & Luchterhandt, B. (2023). jsPsych: Enabling an open-source collaborative ecosystem of behavioral experiments. Journal of Open Source Software, 8(85), 5351. https://doi.org/10.21105/joss.05351
Lenth, R. V. (2024). Emmeans: Estimated marginal means, aka least-squares means. https://rvlenth.github.io/emmeans/
Lüdecke, D., Patil, I., Ben-Shachar, M. S., Wiernik, B. M., Waggoner, P., & Makowski, D. (2021). see: An R package for visualizing statistical models. Journal of Open Source Software, 6(64), 3393. https://doi.org/10.21105/joss.03393
Makowski, D., Ben-Shachar, M. S., & Lüdecke, D. (2019). bayestestR: Describing effects and their uncertainty, existence and significance within the bayesian framework. Journal of Open Source Software, 4(40), 1541. https://doi.org/10.21105/joss.01541
Marks, D. F. (1973). Visual imagery differences in the recall of pictures. British Journal of Psychology, 64(1), 17–24. https://doi.org/10.1111/j.2044-8295.1973.tb01322.x
Mathôt, S., Schreij, D., & Theeuwes, J. (2012). OpenSesame: An open-source, graphical experiment builder for the social sciences. Behavior Research Methods, 44(2), 314–324. https://doi.org/10.3758/s13428-011-0168-7
McKelvie, S. J. (1995). The VVIQ as a psychometric test of individual differences in visual imagery vividness: A critical quantitative review and plea for direction. Journal of Mental Imagery, 19(3-4), 1–106.
Milton, F., Fulford, J., Dance, C., Gaddum, J., Heuerman-Williamson, B., Jones, K., Knight, K. F., MacKisack, M., Winlove, C., & Zeman, A. (2021). Behavioral and neural signatures of visual imagery vividness extremes: Aphantasia versus hyperphantasia. Cerebral Cortex Communications, 2(2), tgab035. https://doi.org/10.1093/texcom/tgab035
Monzel, M., Dance, C., Azañón, E., & Simner, J. (2023). Aphantasia within the framework of neurodivergence: Some preliminary data and the curse of the confidence gap. Consciousness and Cognition, 115, 103567. https://doi.org/10.1016/j.concog.2023.103567
Monzel, M., Leelaarporn, P., Lutz, T., Schultz, J., Brunheim, S., Reuter, M., & McCormick, C. (2023). Hippocampal-occipital connectivity reflects autobiographical memory deficits in aphantasia. https://doi.org/10.1101/2023.08.11.552915
Morey, R. D., & Rouder, J. N. (2024). BayesFactor: Computation of bayes factors for common designs. https://richarddmorey.github.io/BayesFactor/
Muraki, E. J., Speed, L. J., & Pexman, P. M. (2023). Insights into embodied cognition and mental imagery from aphantasia. Nature Reviews Psychology. https://doi.org/10.1038/s44159-023-00221-9
Nelson, H. E. (1976). A modified card sorting test sensitive to frontal lobe defects. Cortex, 12(4), 313–324. https://doi.org/10.1016/S0010-9452(76)80035-4
Paivio, A., & Ernest, C. H. (1971). Imagery ability and visual perception of verbal and nonverbal stimuli. Perception & Psychophysics, 10(6), 429–432. https://doi.org/10.3758/BF03210327
Palermo, L., Boccia, M., Piccardi, L., & Nori, R. (2022). Congenital lack and extraordinary ability in object and spatial imagery: An investigation on sub-types of aphantasia and hyperphantasia. Consciousness and Cognition, 103, 103360. https://doi.org/10.1016/j.concog.2022.103360
Pearson, J. (2019). The human imagination: The cognitive neuroscience of visual mental imagery. Nature Reviews Neuroscience, 20(1010), 624–634. https://doi.org/10.1038/s41583-019-0202-9
Pearson, J., & Keogh, R. (2019). Redefining visual working memory: A cognitive-strategy, brain-region approach. Current Directions in Psychological Science, 28(3), 266–273. https://doi.org/10.1177/0963721419835210
Pedersen, T. L. (2024). Patchwork: The composer of plots. https://patchwork.data-imaginist.com
Posit team. (2025). RStudio: Integrated development environment for r. Posit Software, PBC. http://www.posit.co/
Pounder, Z., Jacob, J., Evans, S., Loveday, C., Eardley, A. F., & Silvanto, J. (2022). Only minimal differences between individuals with congenital aphantasia and those with typical imagery on neuropsychological tasks that involve imagery. Cortex, 148, 180–192. https://doi.org/10.1016/j.cortex.2021.12.010
Psutka, J. V., & Psutka, J. (2019). Sample size for maximum-likelihood estimates of gaussian model depending on dimensionality of pattern space. Pattern Recognition, 91, 25–33. https://doi.org/10.1016/j.patcog.2019.01.046
Purkart, R., Delem, M., Ranson, V., Andrey, C., Versace, R., Cavalli, E., & Plancher, G. (2024). Are there unconscious visual images in aphantasia? Development of an implicit priming paradigm. Cognition, 256, 106059. https://doi.org/10.1016/j.cognition.2024.106059
R Core Team. (2024). R: A language and environment for statistical computing. R Foundation for Statistical Computing. https://www.R-project.org/
Ramful, A., Lowrie, T., & Logan, T. (2017). Measurement of spatial ability: Construction and validation of the spatial reasoning instrument for middle school students. Journal of Psychoeducational Assessment, 35(7), 709–727. https://doi.org/10.1177/0734282916659207
Raven, J. C., & Court, J. H. (1938). Raven’s progressive matrices. Western Psychological Services Los Angeles.
Reeder, R. R., Pounder, Z., Figueroa, A., Jüllig, A., & Azañón, E. (2024). Non-visual spatial strategies are effective for maintaining precise information in visual working memory. Cognition, 251, 105907. https://doi.org/10.1016/j.cognition.2024.105907
Richardson, A. (1977). The meaning and measurement of memory imagery. British Journal of Psychology, 68(1), 29–43. https://doi.org/10.1111/j.2044-8295.1977.tb01556.x
Scrucca, L., Fraley, C., Murphy, T. B., & Raftery, A. E. (2023). Model-based clustering, classification, and density estimation using mclust in R. Chapman; Hall/CRC. https://doi.org/10.1201/9781003277965
Shepard, R. N., & Metzler, J. (1971). Mental rotation of three-dimensional objects. Science, 171(3972), 701–703. https://doi.org/10.1126/science.171.3972.701
Steinley, D., & Brusco, M. J. (2011). Evaluating mixture modeling for clustering: Recommendations and cautions. Psychological Methods, 16(1), 63–79. https://doi.org/10.1037/a0022673
Suggate, S., & Lenhard, W. (2022). Mental imagery skill predicts adults’ reading performance. Learning and Instruction, 80, 101633. https://doi.org/10.1016/j.learninstruc.2022.101633
Vannucci, M., Cioli, L., Chiorri, C., Grazi, A., & Kozhevnikov, M. (2006). Individual differences in visuo-spatial imagery: Further evidence for the distinction between object and spatial imagers. Cognitive Processing, 7(1), 144–145. https://doi.org/10.1007/s10339-006-0108-0
Wai, J., Lubinski, D., & Benbow, C. P. (2009). Spatial ability for STEM domains: Aligning over 50 years of cumulative psychological knowledge solidifies its importance. Journal of Educational Psychology, 101, 817–835. https://doi.org/10.1037/a0016127
Wallace, B. (1990). Imagery vividness, hypnotic susceptibility, and the perception of fragmented stimuli. Journal of Personality and Social Psychology, 58(2), 354–359. https://doi.org/10.1037/0022-3514.58.2.354
Wechsler, D., Coalson, D. L., & Raiford, S. E. (2008). Wechsler adult intelligence scale (technical and interpretive manual 4th ed.). San antonio: NCS pearson. Inc.
Wicken, M., Keogh, R., & Pearson, J. (2021). The critical role of mental imagery in human emotion: Insights from fear-based imagery and aphantasia. Proceedings of the Royal Society B: Biological Sciences, 288(1946), 20210267. https://doi.org/10.1098/rspb.2021.0267
Wickham, H. (2016). ggplot2: Elegant graphics for data analysis. Springer-Verlag New York. https://ggplot2.tidyverse.org
Wickham, H., Averick, M., Bryan, J., Chang, W., McGowan, L. D., François, R., Grolemund, G., Hayes, A., Henry, L., Hester, J., Kuhn, M., Pedersen, T. L., Miller, E., Bache, S. M., Müller, K., Ooms, J., Robinson, D., Seidel, D. P., Spinu, V., … Yutani, H. (2019). Welcome to the tidyverse. Journal of Open Source Software, 4(43), 1686. https://doi.org/10.21105/joss.01686
Zakharov, K. (2016). Application of k-means clustering in psychological studies. The Quantitative Methods for Psychology, 12(2), 87–100. https://doi.org/10.20982/tqmp.12.2.p087
Zeman, A., Dewar, M., & Della Sala, S. (2015). Lives without imagery – congenital aphantasia. Cortex, 73, 378–380. https://doi.org/10.1016/j.cortex.2015.05.019
Zeman, A., Milton, F., Della Sala, S., Dewar, M., Frayling, T., Gaddum, J., Hattersley, A., Heuerman-Williamson, B., Jones, K., MacKisack, M., & al., et. (2020). Phantasia–the psychological significance of lifelong visual imagery vividness extremes. Cortex, 130, 426–440. https://doi.org/10.1016/j.cortex.2020.04.003
Tables
| Variable | Control (n = 51) | Aphantasia (n = 45) | Difference () | 95% CrI | |
|---|---|---|---|---|---|
| VVIQ | 58.08 (10.81) | 18.33 (4.24) | 39.67 | [36.21, 43.18] | 64.33 |
| OSIVQ-Object | 54.04 (9.63) | 24.6 (6.96) | 29.37 | [25.76, 32.76] | 37.94 |
| OSIVQ-Spatial | 43.59 (9.25) | 39.22 (8.75) | 4.46 | [0.84, 8.29] | -0.70 |
| OSIVQ-Verbal | 43.22 (7.52) | 49.38 (11.13) | -6.39 | [-10.12, -2.53] | 1.63 |
| Psi-Q Vision | 8.33 (1.47) | 1.76 (1.21) | 6.55 | [6, 7.1] | 58.94 |
| Psi-Q Audition | 8.08 (1.74) | 2.92 (2.79) | 5.08 | [4.15, 5.96] | 24.25 |
| Psi-Q Smell | 7.01 (2.36) | 1.78 (1.61) | 5.21 | [4.38, 6.05] | 26.51 |
| Psi-Q Taste | 6.88 (2.37) | 2.14 (2.15) | 4.66 | [3.76, 5.59] | 17.89 |
| Psi-Q Touch | 8.36 (1.84) | 2.64 (2.51) | 5.62 | [4.73, 6.47] | 30.68 |
| Psi-Q Sensations | 7.93 (1.9) | 2.99 (2.67) | 4.82 | [3.93, 5.73] | 19.56 |
| Psi-Q Feelings | 7.8 (2.11) | 3.5 (2.97) | 4.16 | [3.17, 5.14] | 14.29 |
| Raven matrices | 12.67 (3.23) | 13.93 (2.27) | -1.22 | [-2.35, -0.03] | -1.30 |
| SRI | 21.18 (4.86) | 22.58 (3.8) | -1.45 | [-3.3, 0.28] | -2.20 |
| Digit span | 4.07 (0.98) | 4.2 (1.19) | -0.14 | [-0.59, 0.31] | -3.28 |
| Spatial span | 3.1 (1.25) | 3.53 (0.76) | -0.47 | [-0.91, -0.07] | -1.01 |
| Similarities test | 23 (5.22) | 24.31 (4.38) | -1.25 | [-3.18, 0.71] | -2.68 |
| WCST | 62.8 (15.46) | 64.93 (13.63) | -2.18 | [-8.04, 3.73] | -3.22 |
| Reading | |||||
| comprehension | 16.9 (6.8) | 19.11 (5.15) | -2.20 | [-4.67, 0.26] | -1.94 |
| Variable | Comparison | Difference () | 95% CrI | |
|---|---|---|---|---|
| Visual imagery | A (Aphant.) - B (Mixed) | -0.28 | [-0.36, -0.2] | 10.63 |
| Visual imagery | A (Aphant.) - C (Control) | -0.63 | [-0.71, -0.55] | 29.07 |
| Visual imagery | B (Mixed) - C (Control) | -0.35 | [-0.43, -0.27] | 14.36 |
| Auditory imagery | A (Aphant.) - B (Mixed) | -0.46 | [-0.59, -0.33] | 11.37 |
| Auditory imagery | A (Aphant.) - C (Control) | -0.70 | [-0.82, -0.57] | 21.61 |
| Auditory imagery | B (Mixed) - C (Control) | -0.24 | [-0.37, -0.12] | 2.33 |
| Sensory imagery | A (Aphant.) - B (Mixed) | -0.42 | [-0.53, -0.31] | 13.59 |
| Sensory imagery | A (Aphant.) - C (Control) | -0.67 | [-0.77, -0.56] | 27.02 |
| Sensory imagery | B (Mixed) - C (Control) | -0.25 | [-0.36, -0.14] | 3.99 |
| Spatial imagery | A (Aphant.) - B (Mixed) | -0.13 | [-0.19, -0.08] | 5.52 |
| Spatial imagery | A (Aphant.) - C (Control) | 0.05 | [0, 0.11] | -1.74 |
| Spatial imagery | B (Mixed) - C (Control) | 0.18 | [0.13, 0.24] | 13.55 |
| Verbal strategies | A (Aphant.) - B (Mixed) | 0.19 | [0.12, 0.27] | 6.86 |
| Verbal strategies | A (Aphant.) - C (Control) | 0.16 | [0.08, 0.23] | 4.31 |
| Verbal strategies | B (Mixed) - C (Control) | -0.04 | [-0.11, 0.03] | -3.19 |
| Raven + | ||||
| Digit Span | A (Aphant.) - B (Mixed) | -0.03 | [-0.09, 0.02] | -2.38 |
| Raven + | ||||
| Digit Span | A (Aphant.) - C (Control) | 0.01 | [-0.04, 0.06] | -3.19 |
| Raven + | ||||
| Digit Span | B (Mixed) - C (Control) | 0.04 | [-0.01, 0.09] | -2.20 |
| Verbal reasoning | A (Aphant.) - B (Mixed) | -0.08 | [-0.15, -0.02] | -0.29 |
| Verbal reasoning | A (Aphant.) - C (Control) | 0.05 | [-0.02, 0.11] | -2.26 |
| Verbal reasoning | B (Mixed) - C (Control) | 0.13 | [0.06, 0.19] | 3.33 |
| Spatial span std. | A (Aphant.) - B (Mixed) | -0.07 | [-0.16, 0.01] | -1.91 |
| Spatial span std. | A (Aphant.) - C (Control) | 0.11 | [0.03, 0.2] | 0.16 |
| Spatial span std. | B (Mixed) - C (Control) | 0.18 | [0.1, 0.27] | 4.23 |
| WCST | A (Aphant.) - B (Mixed) | -0.02 | [-0.09, 0.05] | -3.15 |
| WCST | A (Aphant.) - C (Control) | 0.06 | [-0.01, 0.13] | -1.87 |
| WCST | B (Mixed) - C (Control) | 0.08 | [0.01, 0.15] | -1.26 |
| Reading | ||||
| comprehension | A (Aphant.) - B (Mixed) | -0.03 | [-0.13, 0.07] | -3.11 |
| Reading | ||||
| comprehension | A (Aphant.) - C (Control) | 0.07 | [-0.03, 0.17] | -2.24 |
| Reading | ||||
| comprehension | B (Mixed) - C (Control) | 0.10 | [0, 0.2] | -1.55 |