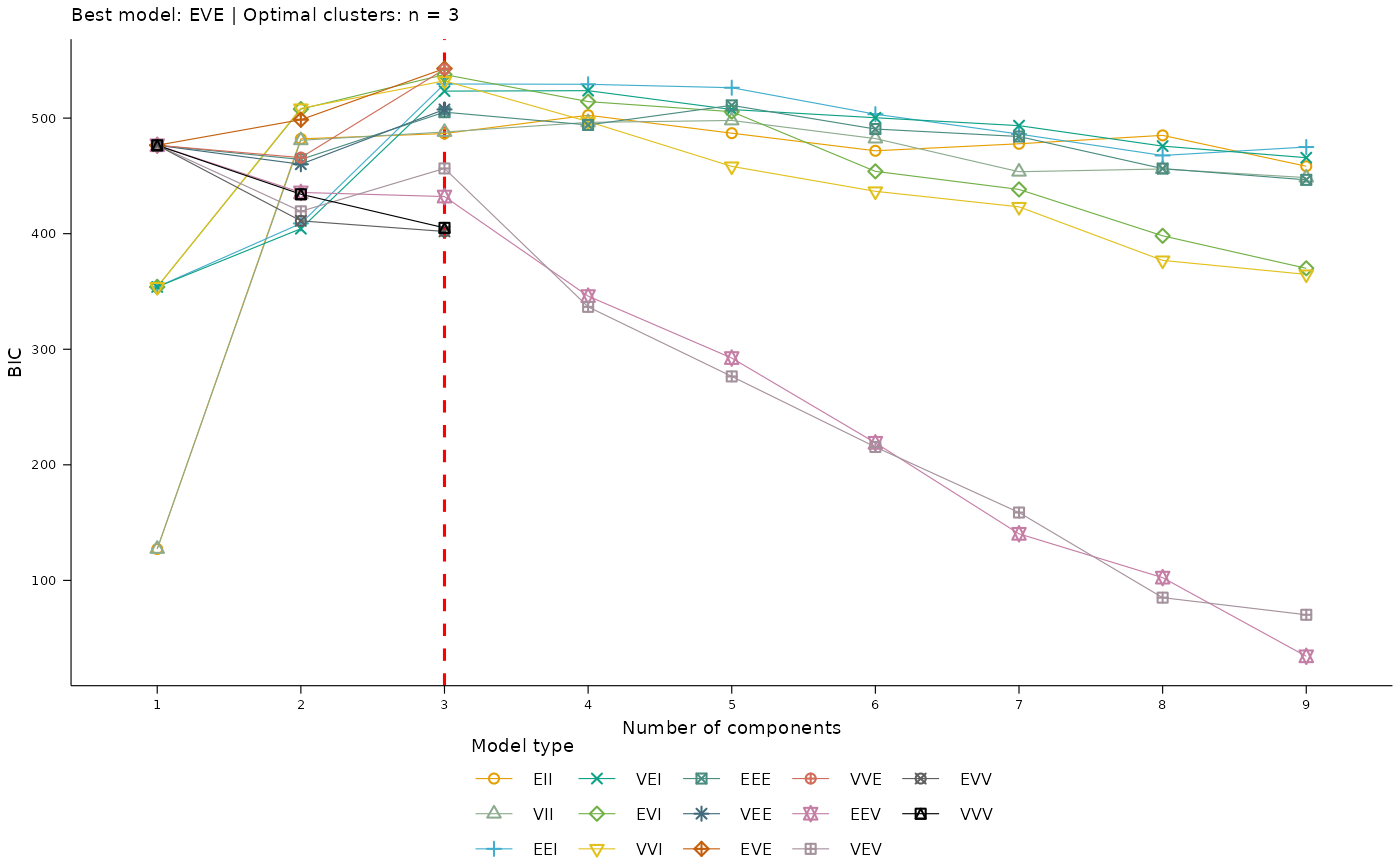
Plot the comparison of Gaussian Mixture Models (GMM) BIC scores
Source:R/plot_clusters_bic.R
plot_clusters_bic.RdThis function is a wrapper around the factoextra::fviz_mclust_bic()
function to plot the Bayesian Information Criterion (BIC) scores of
Gaussian Mixture Models (GMM) fitted to a dataset. It is mainly designed to
facilitate the setting of various default options that fit the graphical
style of the project.
Arguments
- mclust_object
A fitted Mclust object containing the clustering results, usually from
cluster_selected_vars().- txt_big
Size of the plot, x-axis and legend titles. Default is 7.
- txt_mid
Size of the legend text. Default is 6.
- txt_smol
Size of the axis text. Default is 5.
- size
Size of the points in the plot. Default is 0.2.
Examples
study_data |> cluster_selected_vars() |> plot_clusters_bic()