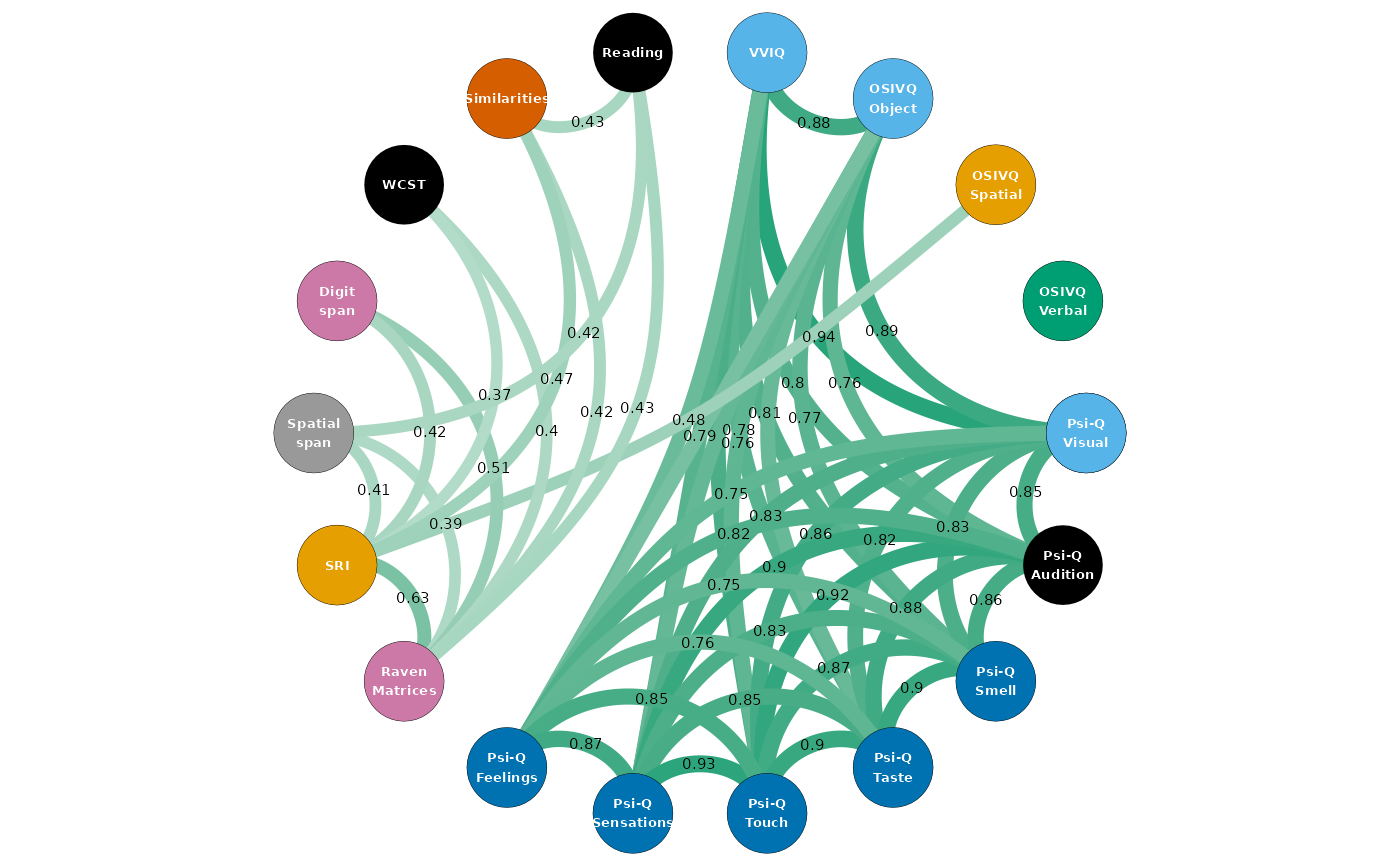
This function creates a graph visualisation of a set of correlations
computed using correlation::correlation(), such as the result of
correlate_vars(). It is designed to highlight nodes for specific variables
from the study (based on partial correlations), but it should run with any
set of correlations.
Usage
plot_score_cor_graph(
  correlations,
  shape = 21,
  stroke = 0.1,
  node_size = 14,
  node_text_size = 5,
  label_text_size = 2
)
Arguments
- correlations
A data frame containing the correlations, typically the output of
correlate_vars().- shape
Shape of the nodes in the graph. Default is 21 (circle).
- stroke
Stroke width of the nodes. Default is 0.1.
- node_size
Size of the nodes in the graph. Default is 14.
- node_text_size
Size of the text labels on the nodes. Default is 5.
- label_text_size
Size of the text labels on the edges. Default is 2.
Examples
study_data |> correlate_vars(partial = FALSE) |> plot_score_cor_graph()