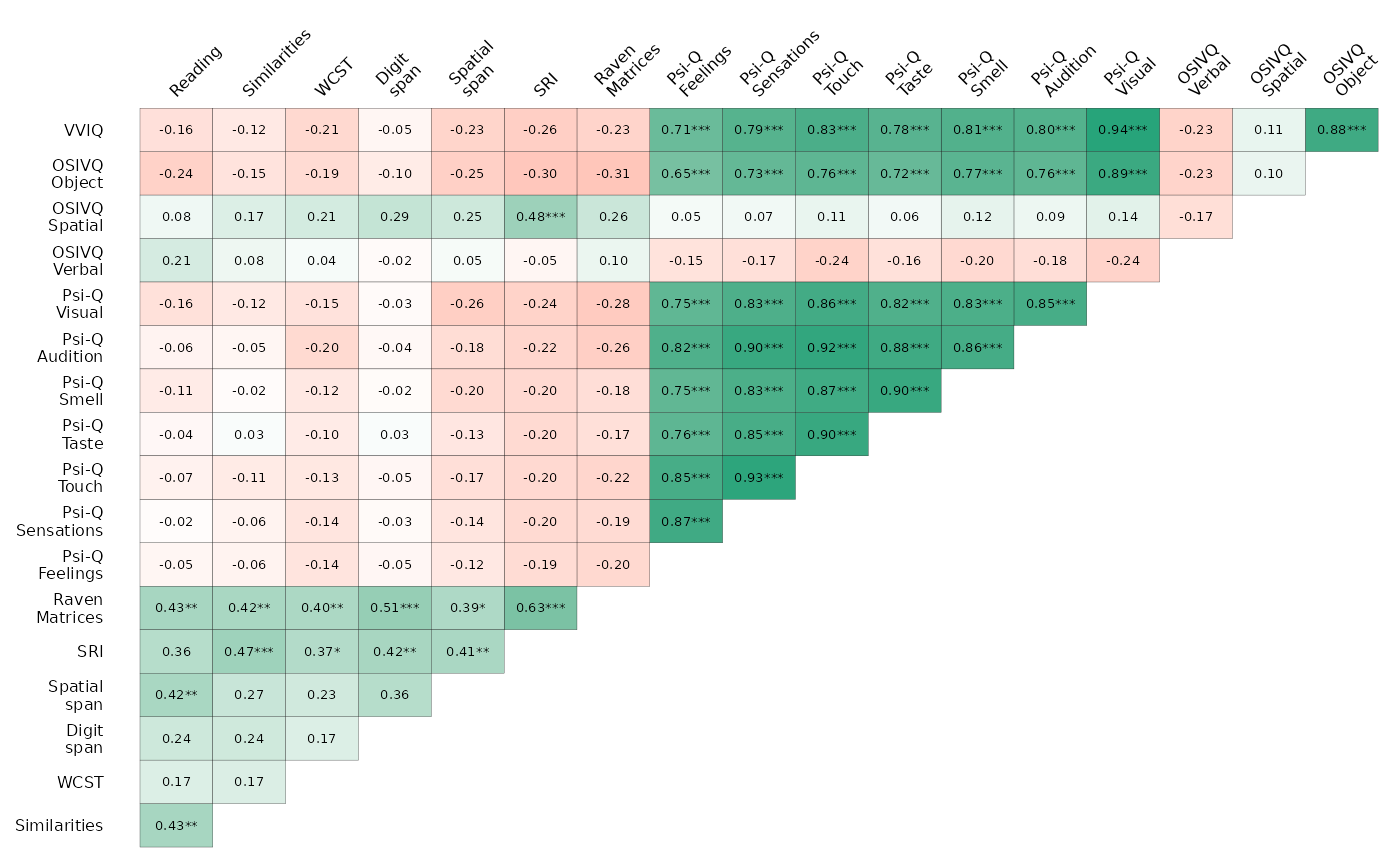
This function is a wrapper around the correlation::visualisation_recipe()
function to plot a correlation matrix from the correlation package with
custom pre-defined options. It was designed to fit the graphical style of the
project, but it is not specific to the project and can be used with any
correlation matrix data.
Arguments
- correlations
An object produced by
correlation::correlation(), such as the output ofcorrelate_vars().- size_axis
Size of the axis text in points. Default is 6.
- matrix_text
Size of the text in the correlation matrix. Default is 5.
Examples
study_data |> correlate_vars(partial = FALSE) |> plot_score_cor_matrix()

