Plot group violins with means and confidence intervals
Source:R/plot_data_distribution.R
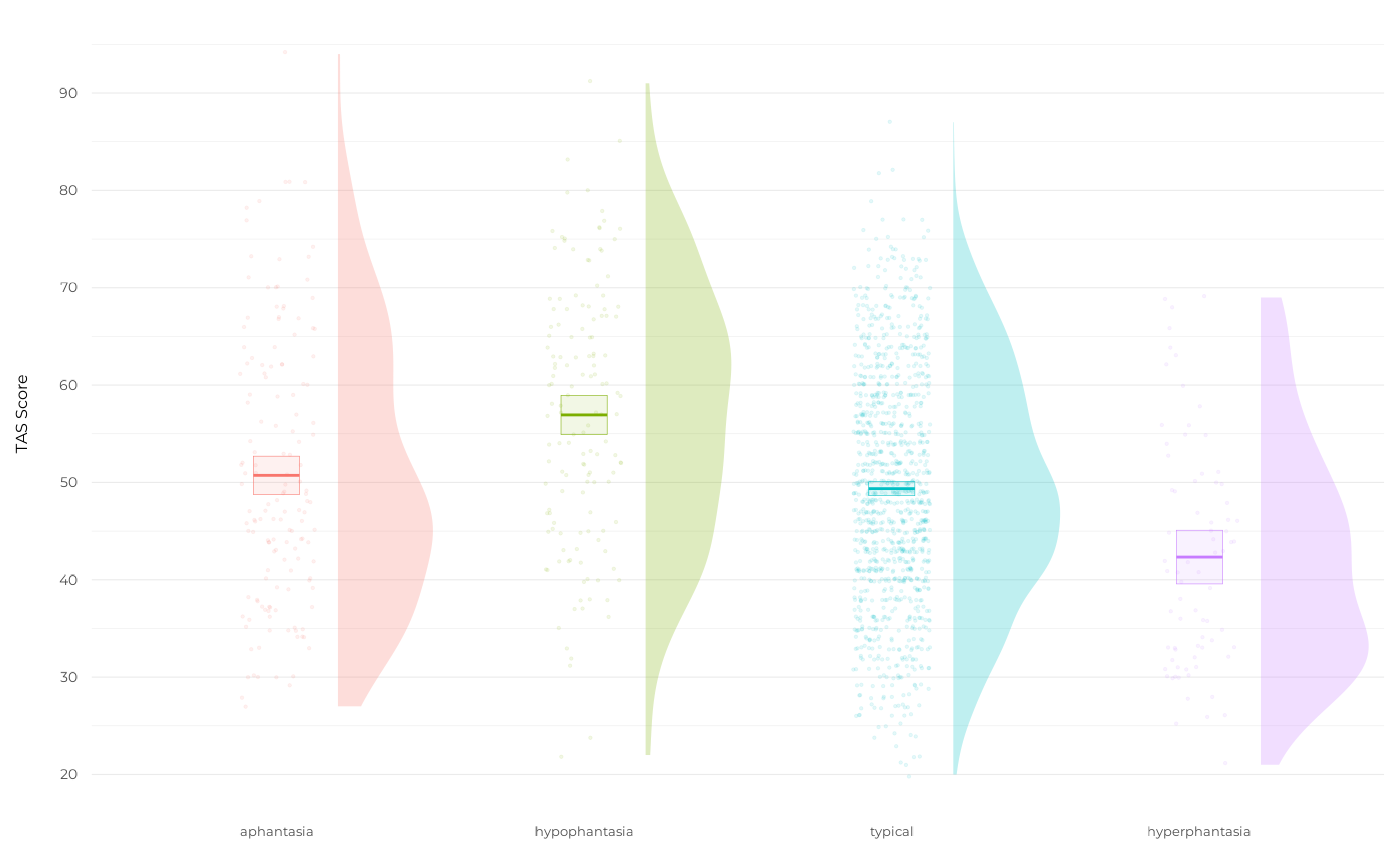
plot_group_violins.RdThis function creates a ggplot object that visualises group data using half-violins, individual data points, and mean estimates with confidence intervals.
Usage
plot_group_violins(
  formula,
  data = all_data,
  dot_size = 0.5,
  box.linewidth = 0.1,
  middle.linewidth = 0.5,
  violin_width = 0.7,
  title = NULL,
  subtitle = NULL,
  caption = NULL,
  x_lab = NULL,
  y_lab = "Score",
  breaks = scales::breaks_pretty(10),
  base_theme = ggplot2::theme_minimal,
  axis_relative_size = 1,
  axis_relative_x = 0.8,
  axis_relative_y = 0.85,
  ...
)
Arguments
- formula
A formula specifying the response and grouping variables.
- data
Data frame containing the data. Default is
all_data.- dot_size
Size of the individual data points. Default is 0.5.
- box.linewidth
Line width of the box in the crossbar. Default is 0.1.
- middle.linewidth
Line width of the middle line in the crossbar. Default is 0.5.
- violin_width
Width of the half-violins. Default is 0.7.
- title
Title of the plot.
- subtitle
Subtitle of the plot.
- caption
Caption of the plot.
- x_lab
Label for the x-axis.
- y_lab
Label for the y-axis. Default is "Score".
- breaks
Breaks for the y-axis. Default is
scales::breaks_pretty(10).- base_theme
Base theme for the plot. Default is
ggplot2::theme_minimal.- axis_relative_size
Relative size of the axis text. Default is 1.
- axis_relative_x
Relative size of the x-axis text. Default is 1.
- axis_relative_y
Relative size of the y-axis text. Default is 0.85.
- ...
Additional arguments passed to the
theme_pdf()function.