Plot VVIQ group proportions of a specified variable across studies
Source:R/plot_data_distribution.R
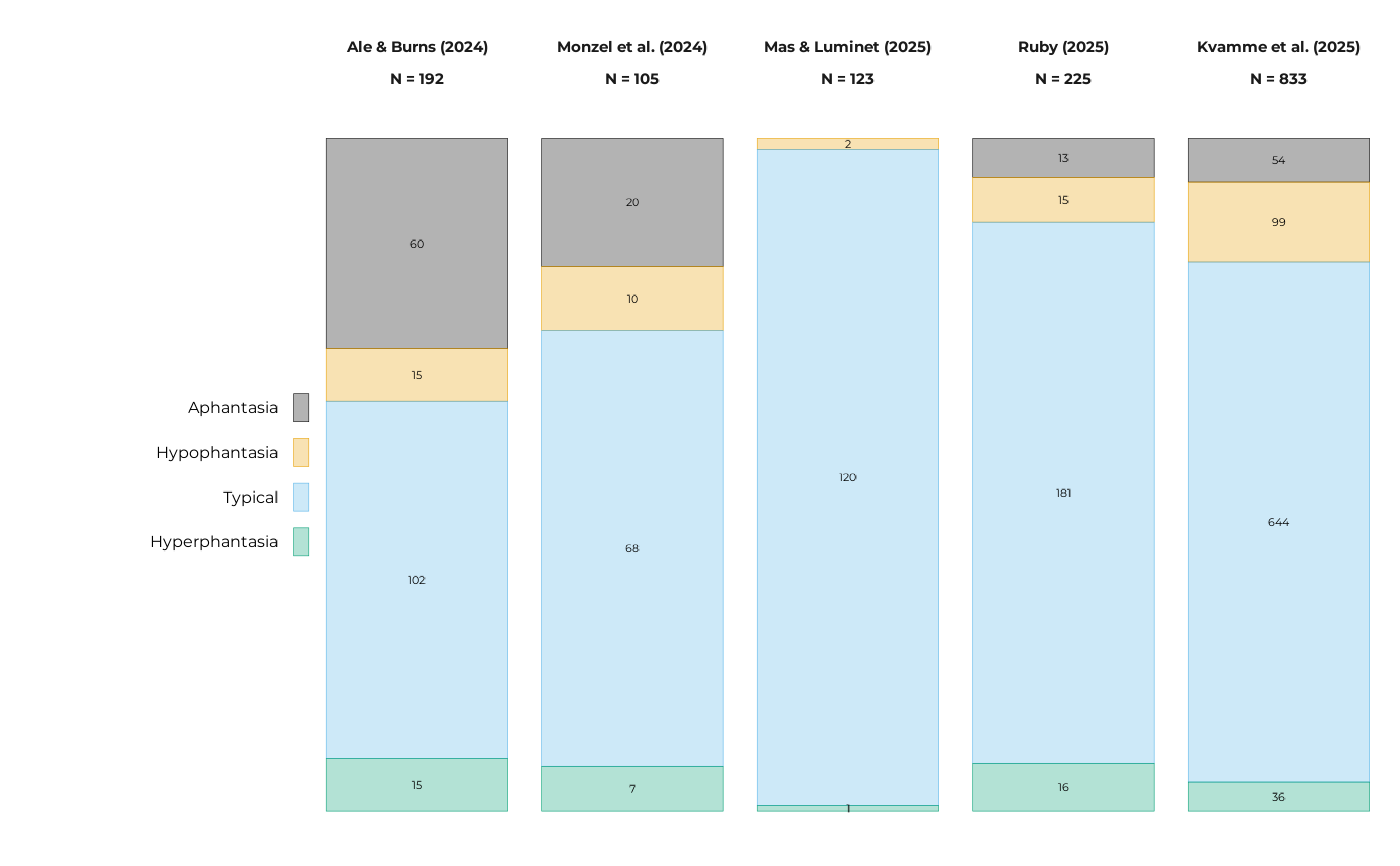
plot_vviq_group_proportions.RdThis function creates a bar plot showing the proportions of a each VVIQ sub-group for a given classification (e.g., vviq_group_4, vviq_group_3, etc.)
Usage
plot_vviq_group_proportions(
  df,
  var,
  bar_alpha = 0.3,
  bar_lw = 0.1,
  prop_txt_size = 1.75,
  marg = 8,
  base_size = 7,
  ...
)
Arguments
- df
Data frame containing the data with the specified variable.
- var
The variable to be plotted (e.g., vviq_group_4).
- bar_alpha
Transparency level of the bars.
- bar_lw
Line width of the bar borders.
- prop_txt_size
Size of the proportion text labels on the bars.
- marg
Margin size around the plot.
- base_size
Base font size for the plot theme.
- ...
Additional arguments passed to the
theme_pdf()function.